
Figure 7.
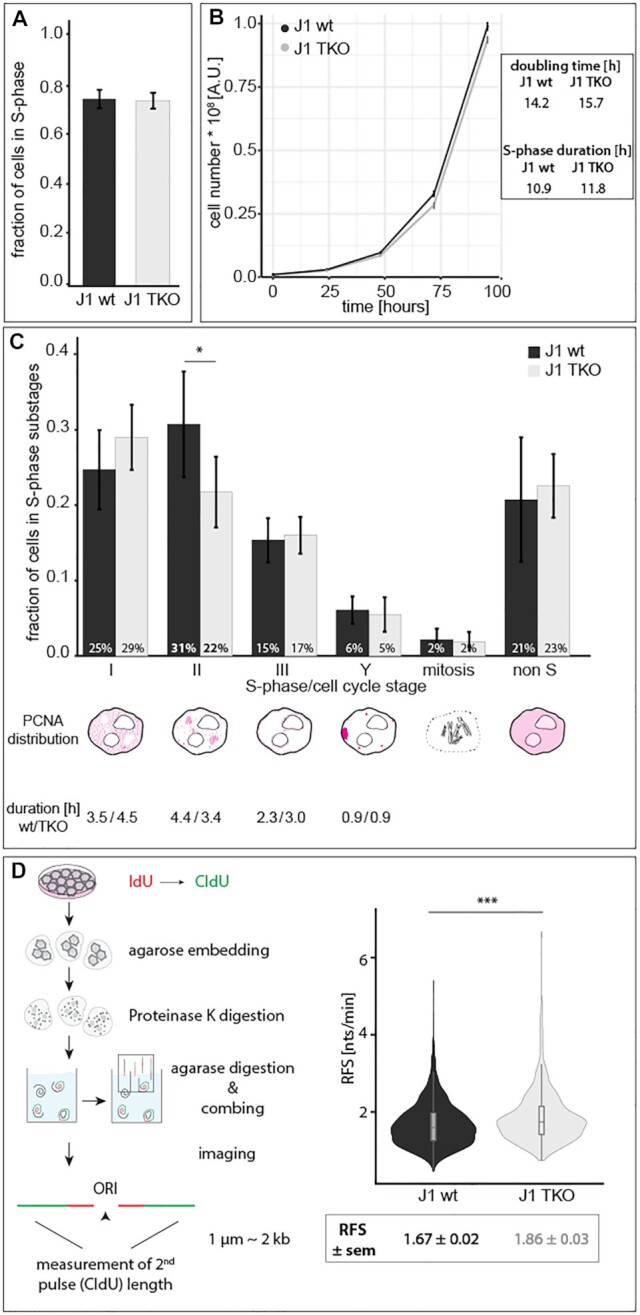
Effect of loss of cytosine modifications in mouse embryonic stem cells on S-phase progression and replication fork speed. (A) Bar plot showing the mean percentage of cells in S-phase in J1 wt and TKO ES cells. (B) Line plots showing the population doubling time of mouse J1 and TKO ES cells over five consecutive days with the ensuing doubling times depicted. S-phase duration was derived from the doubling times and the percentage of S-phase cells. (C) Bar plot showing the mean percentage of cells within the different cell cycle and S-phase substages (S-phase I - Y, G1/G2 (non S) and mitosis) and the ensuing S-phase substage durations. (D) Schematic representation of the molecular combing technique. Violin plots showing the replication fork speed (RFS) of J1 wt and TKO cells. Error bars represent the standard deviation, all boxes and whiskers are as in Figure 2 and independent experiments were performed in quadruplicates (A–C) or in duplicates (D). P (determined by Mann–Whitney–Wilcoxon test) and n-values are summarized in Supplementary Table S7; * P < 0.05 and *** P < 0.001.