Figure 5.
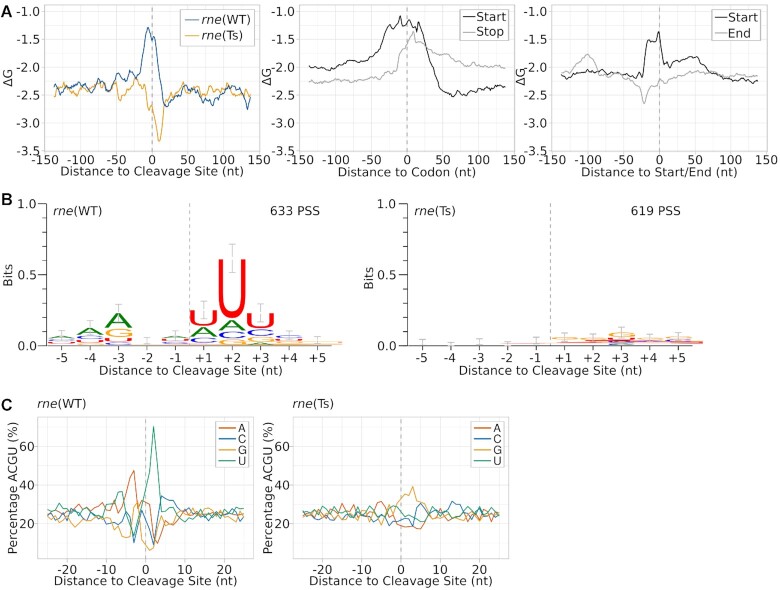
Inference of a sequence signature and folding potential around cleavage sites. (A) Analysis of minimal folding energy (ΔG) around detected cleavage sites, start and stop codons and annotated starts and ends of transcriptional units. Minimal folding energy was calculated at each nucleotide position using a sliding window of 25 nt and a 1 nt step size for a segment of 150 nt up- and downstream of the respective element. (B) Sequence logos of PSS accumulating in rne(WT) or rne(Ts) after heat treatment. Sequences were aligned according to the detected cleavage site. Error bars were calculated by the WebLogo tool and represent an approximate Bayesian 95% confidence interval. (C) Nucleotide composition around detected PSS.

