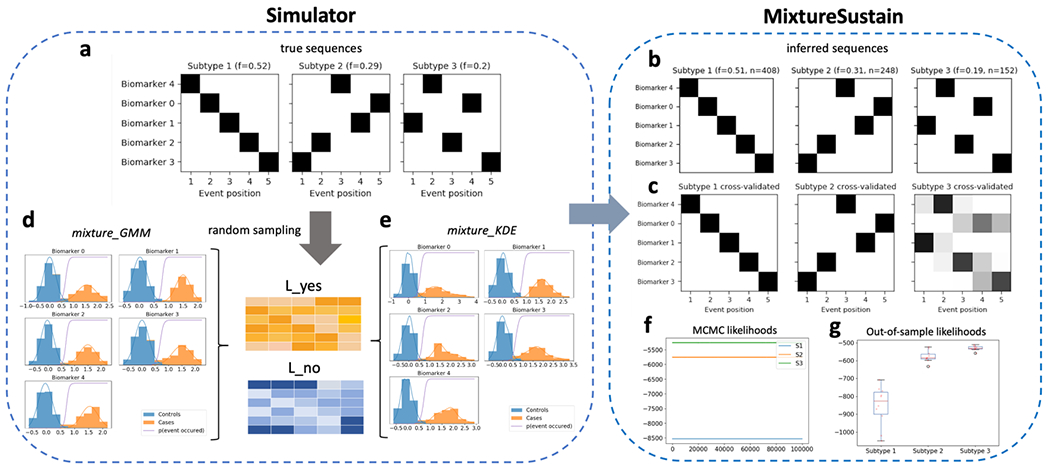
Figure 5.

Schematic of simulated mixture model data as implemented in simrun.py, with the two available mixture model types shown (mixture_GMM or mixture_KDE, based on Gaussian mixture modelling or kernel density estimation, respectively). Inference of three subtypes using MixtureSustain on the simulated input data (L_yes and L_no matrices). Each matrix is a subjects × features matrix storing the probability of subjects’ observations belonging to the mixture-model-derived case (L_yes) or control (L_no) distribution. Figures shown are from the mixture_GMM style; those from the mixture_KDE style are very similar.
