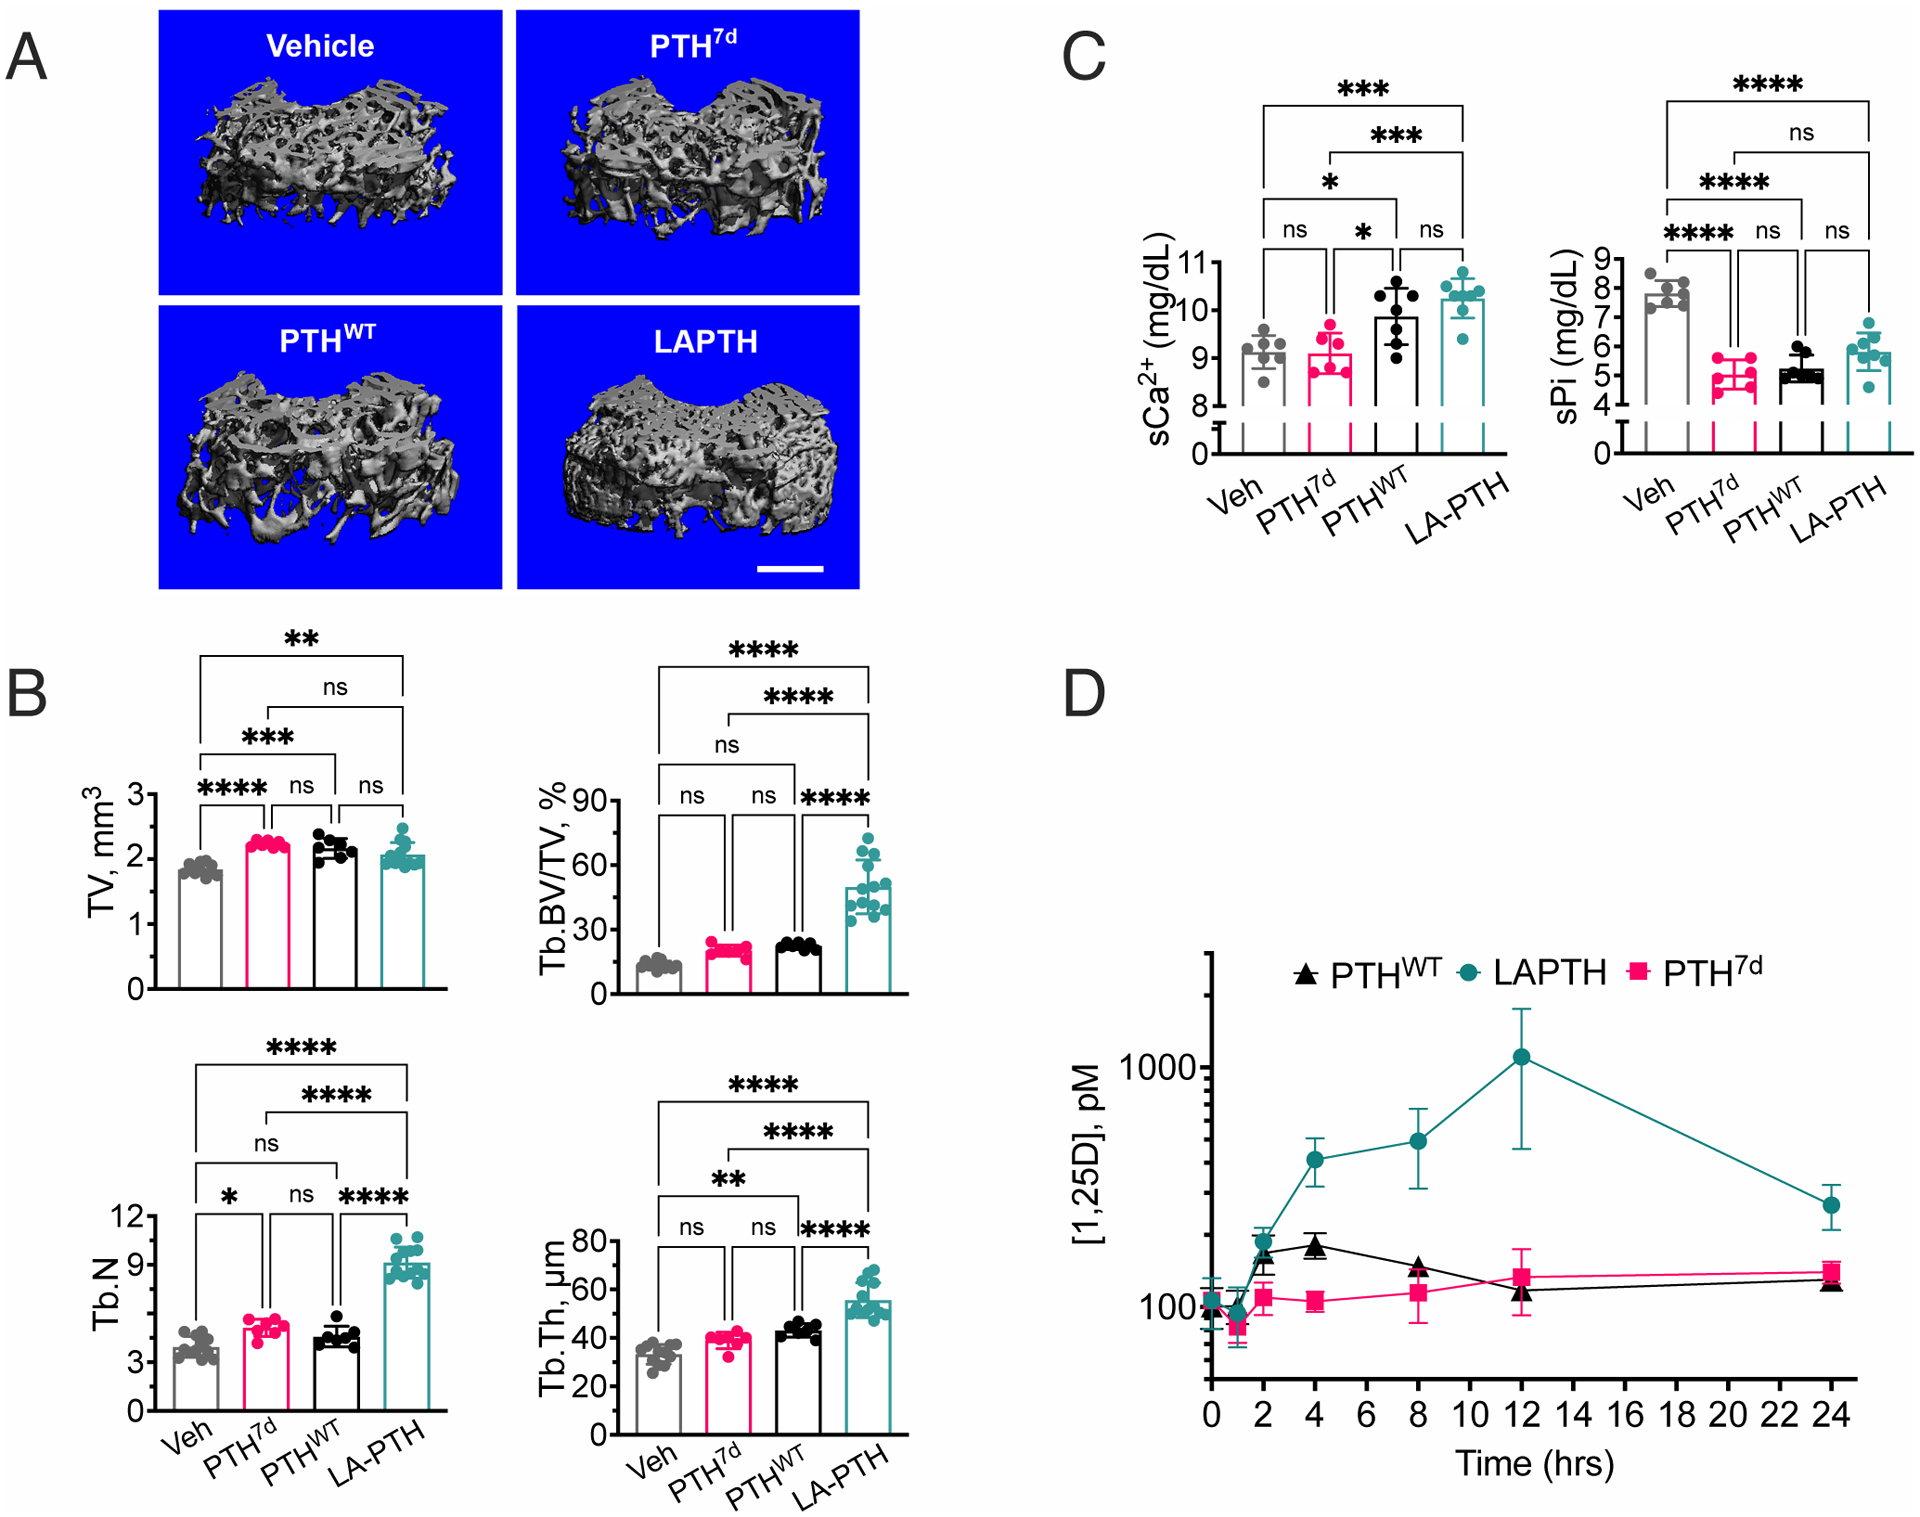
Fig. 4. Differential pharmacological actions of PTH7d, PTHWT, and LAPTH in mice.

(A) 3-D reconstructed micro-computed tomography (μCT) images of secondary spongia at the distal femurs of mice treated with vehicle, PTH7d, PTHWT (PTH1–34), or LAPTH. Scale bar, 500μm.
(B) Quantifications of skeletal parameters in trabecular (Tb) bone of distal femur, including total bone volume (TV), ratio of Tb bone volume (Tb.BV) to TV (Tb.BV/TV), Tb number (Tb.N), and Tb thickeness (Tb.Th). Parameters were assessed in mice subjected to daily injections of PTH7d, PTHWT, LA-PTH, or vehicle (Veh) for 4 weeks. Data are means ± SD from N = 7 mice/group for PTH7d and PTHWT injections and N = 14 mice/group for LA-PTH and Veh injections. *P < 0.03, ***P < 0.002, ***P < 0.0002 and ****P < 0.0001 vs Veh control mice by one-way ANOVA with Tukey-Kramer post-hoc test.
(C) Quantification of serum Ca2+ (sCa2+) and phosphate (sPi) measured 2 hrs after the last of the 4-week daily injections of PTH7d, PTHWT, LA-PTH (40 μg/kg body weight/injection), or vehicle (Veh). Data are means ± SD from N = 7 mice/group. *P < 0.03, **P < 0.002, ***P < 0.0002 and ****P < 0.0001 vs Veh control mice by one-way ANOVA with Tukey-Kramer post-hoc test.
(D) Quantification of serum 1.25D measured in mice before or 1, 2, 4, 8, 12, or 24 hrs after a single injection of PTH, PTH7d, or LA-PTH. Data are means ± SD from N = 7 mice/time point/drug and 15 mice for time “0” controls. Statistical analysis is shown in the Supplementary Materials (fig. S9).
