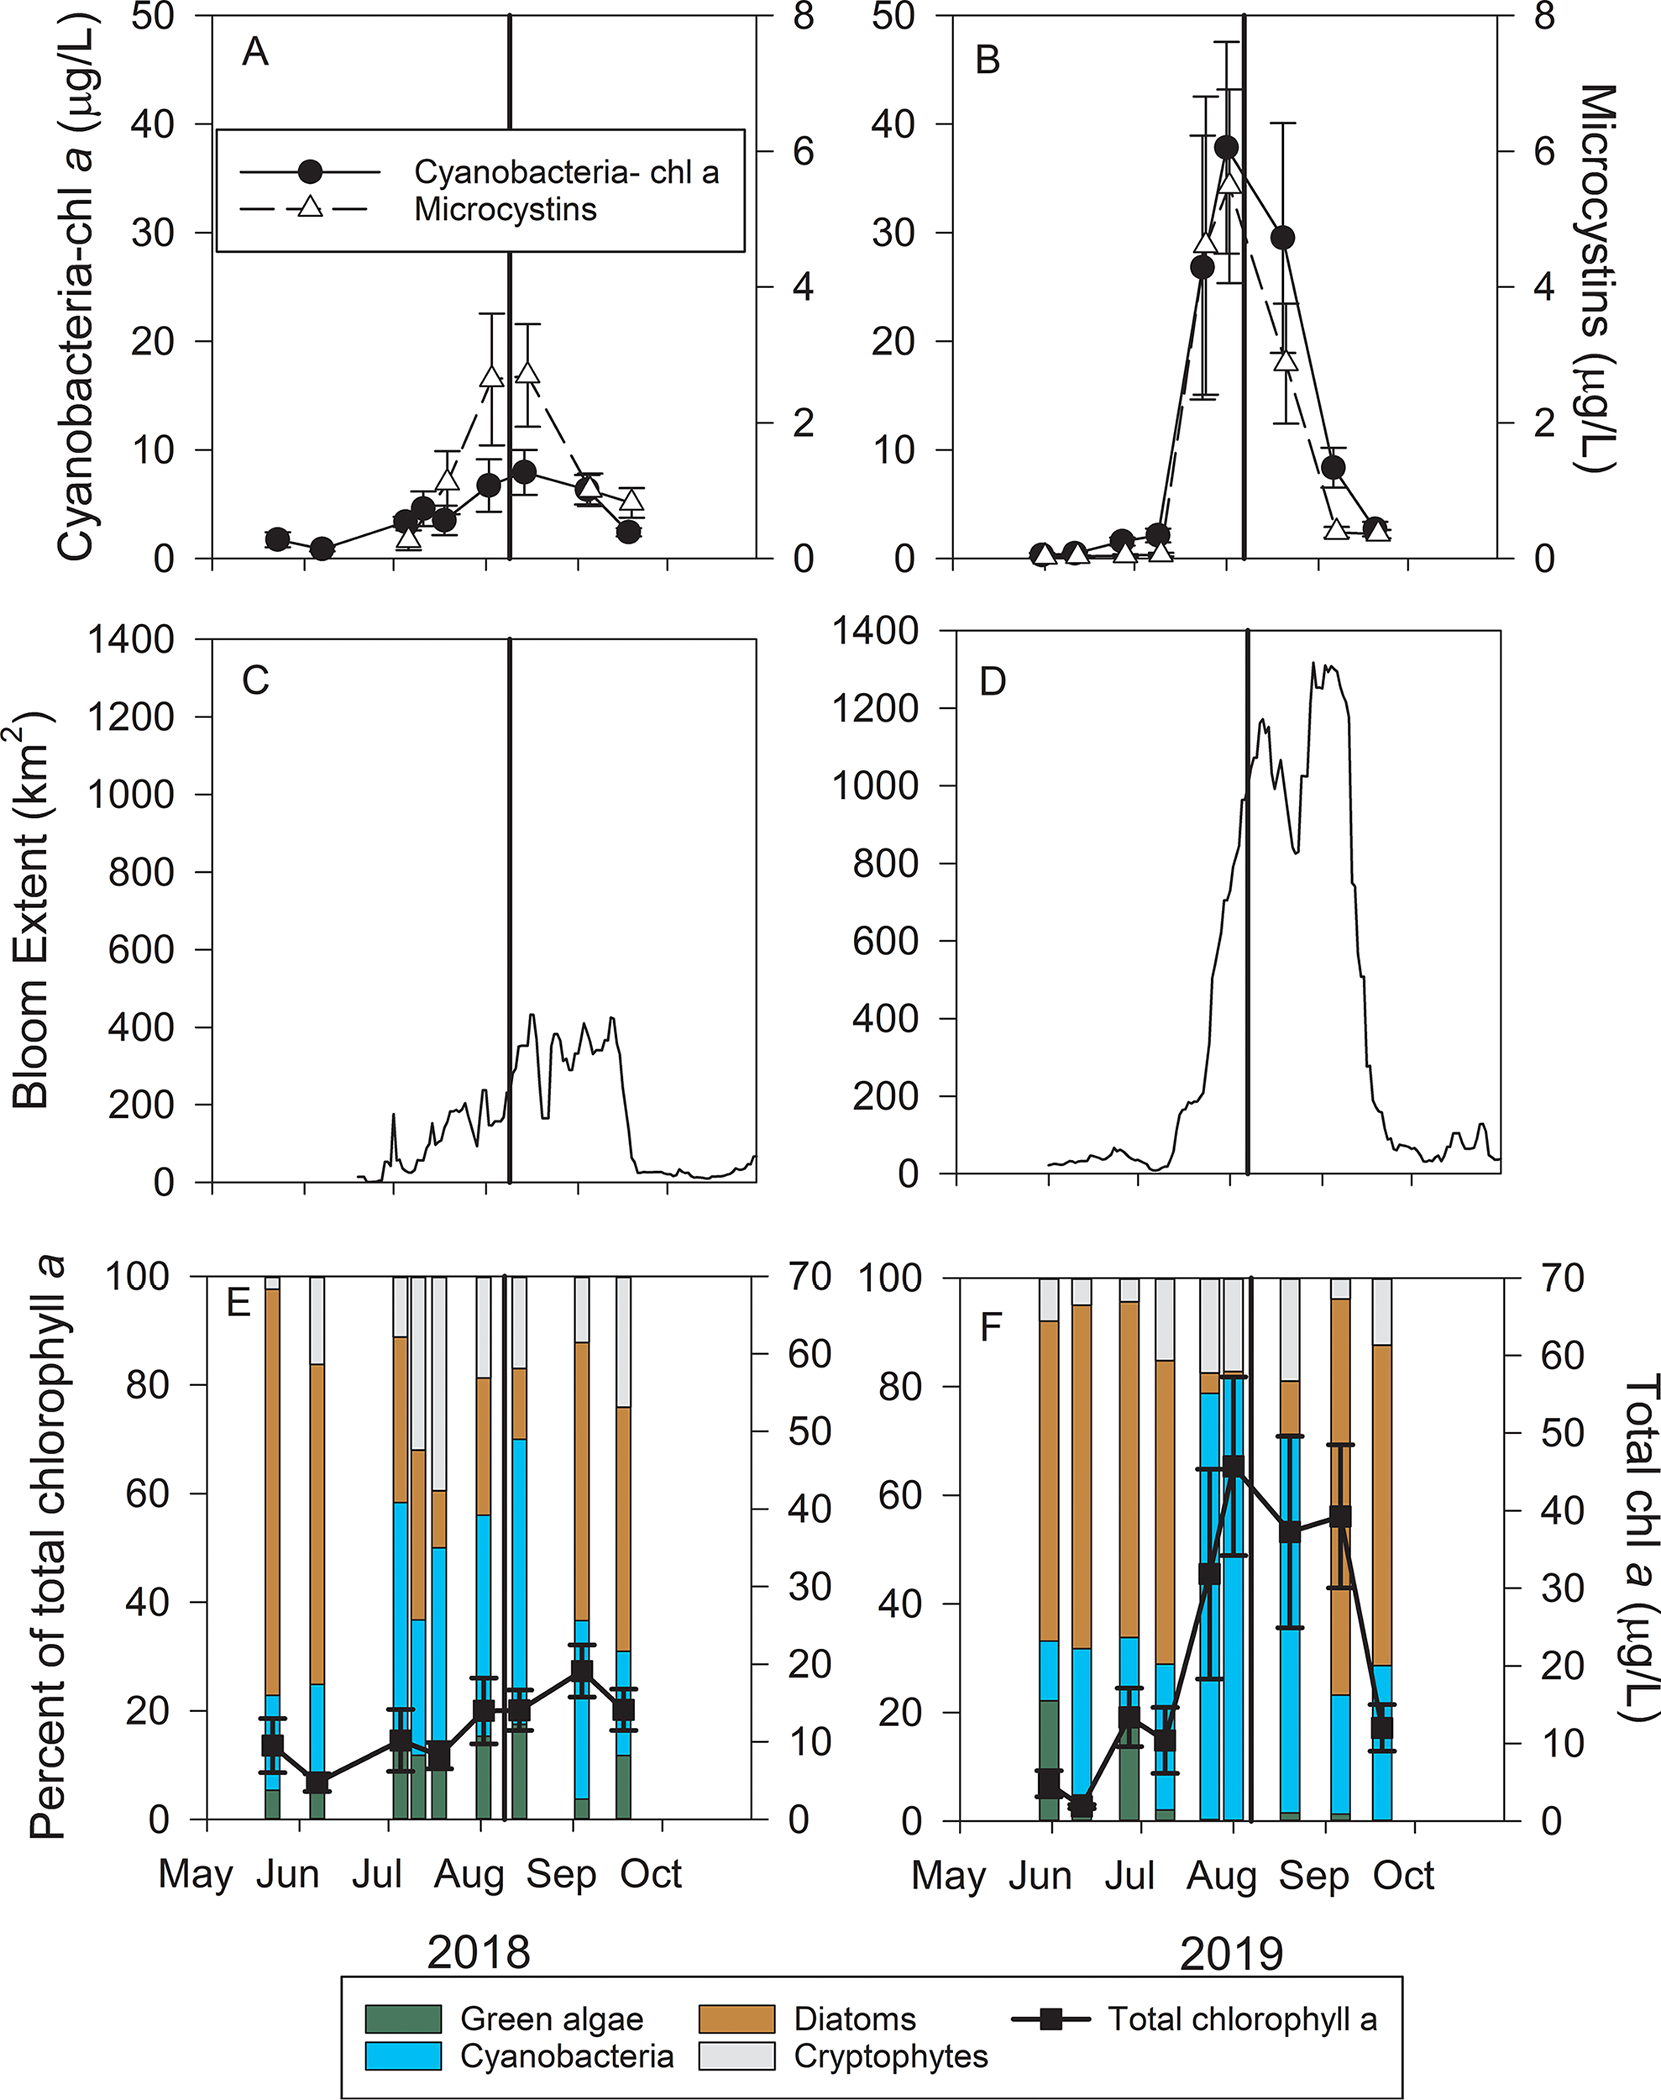
Fig. 1.

Time series of cyanobacterial biomass and microcystins (A & B), 14 day rolling average bloom spatial extent (C & D), and total phytoplankton biomass and the relative abundance of green algae, cyanobacteria, diatoms, and cryptophytes (E & F) in western Lake Erie on 9 August 2018 and 7 August 2019. The values in A, B, E, and F are the mean of five sites (± 1 standard error) monitored by the University of Toledo’s Lake Erie Center. The bold vertical line in each indicates the dates of the HABs Grab event and shows the event occurred during peak bloom conditions each year.
