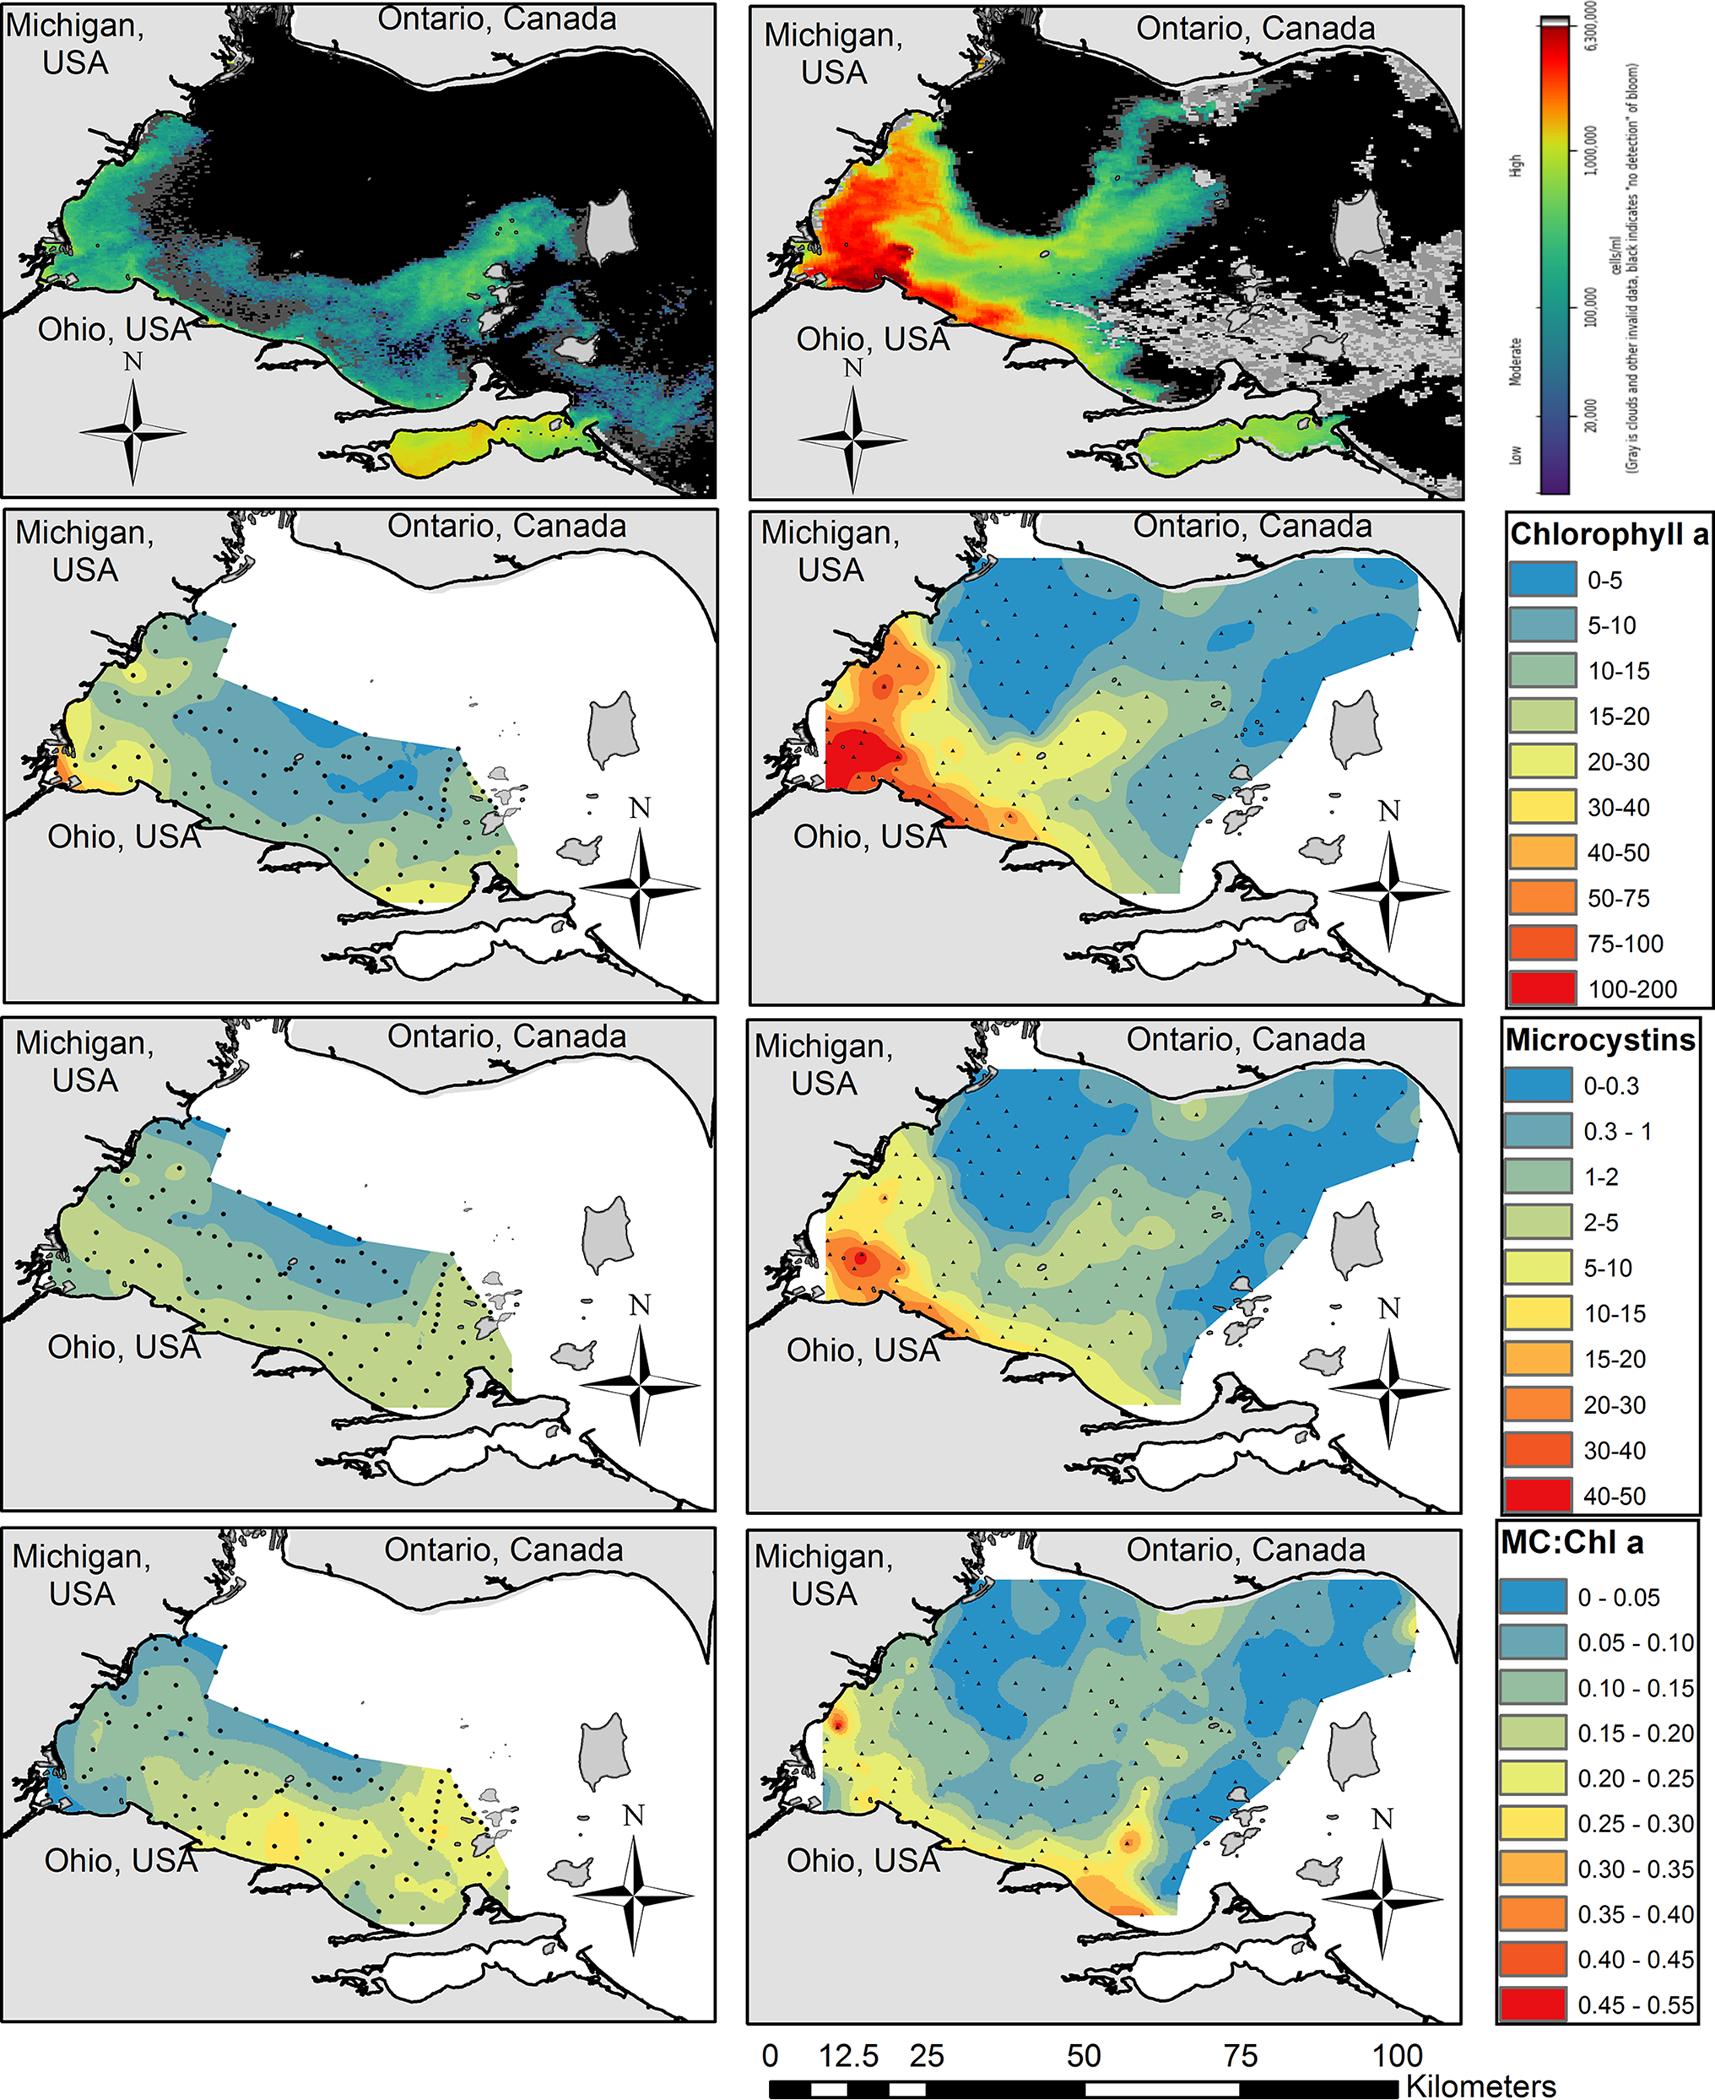
Fig. 2.

Cyanobacterial biomass and microcystins during the 9 August 2018 (left column) and 7 August 2019 (right column) HABs Grab. Top row: NOAA Cyanobacterial Index taken on 5 August 2018 and 7 August 2019. The heat map ranges from 20,000 cells/mL in dark blue to 6300,000 cells/mL in dark red. Black is cells not detected and gray is cloud cover. Second row: Chlorophyll a (μg/L, top). Third row: total microcystins measured by ELISA (μg/L, middle). Bottom row: the ratio of microcystins to chlorophyll a. Small dots on the maps represent the sample collection locations.
