
Fig. 6.
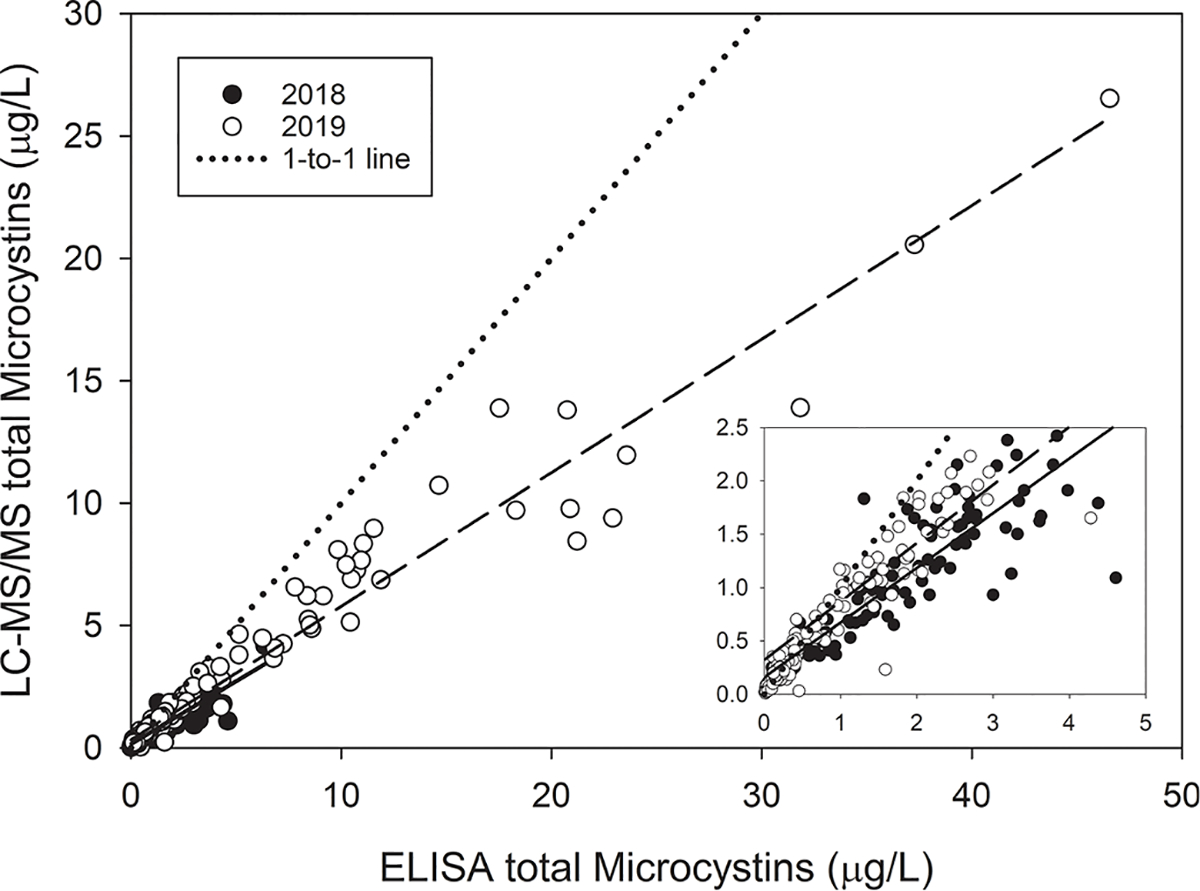
The relationship between total microcystins measured by ELISA and the calculated total microcystins from 13 different congeners during the 9 August 2018 (filled circles, solid regression line) and 7 August 2019 (open circles, dashed regression line) HABs Grab. The dotted line is a 1-to-1 line. The inset panel shows a zoomed in view of the lower range where most of the 2018 samples occurred. 2018 regression equation: LC-MS/MS = (0.5125 * ELISA) + 0.1596, R2 = 0.79. 2019 regression equation: LC-MS/MS = (0.5462 * ELISA) + 0.3229, R2 = 0.95.