
Fig. 7.
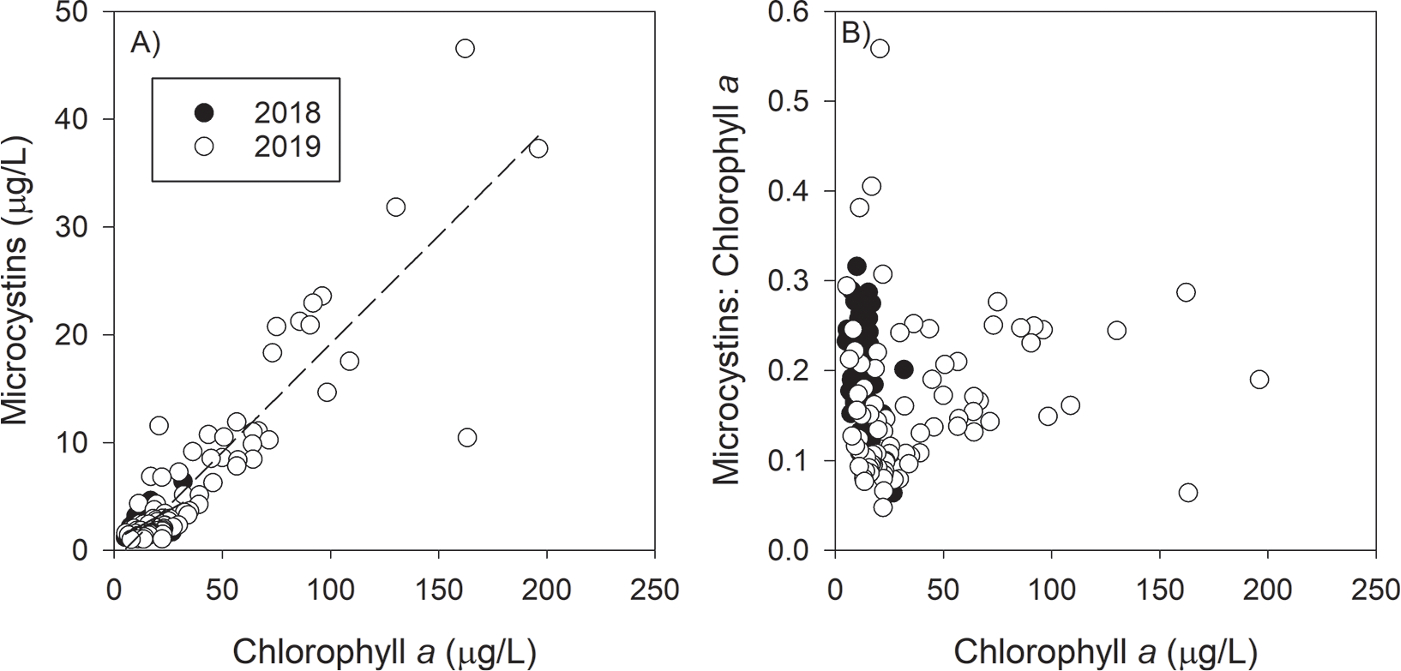
Total microcystins (measured by ELISA) concentration (A) and the microcystins-to-chlorophyll ratio (B) as a function of chlorophyll a concentration for each year. 9 August 2018 regression equation: MC = (0.109 * Chl) + 0.955, R2 = 0.32. 7 August 2019 regression equation: MC = (0.201 * Chl) – 0.927, R2 = 0.80. During the large bloom year of 2019, higher chlorophyll a concentrations corresponded to high toxin-to-biomass ratios, but high toxin-to-biomass ratios were also observed at low chlorophyll a concentrations.