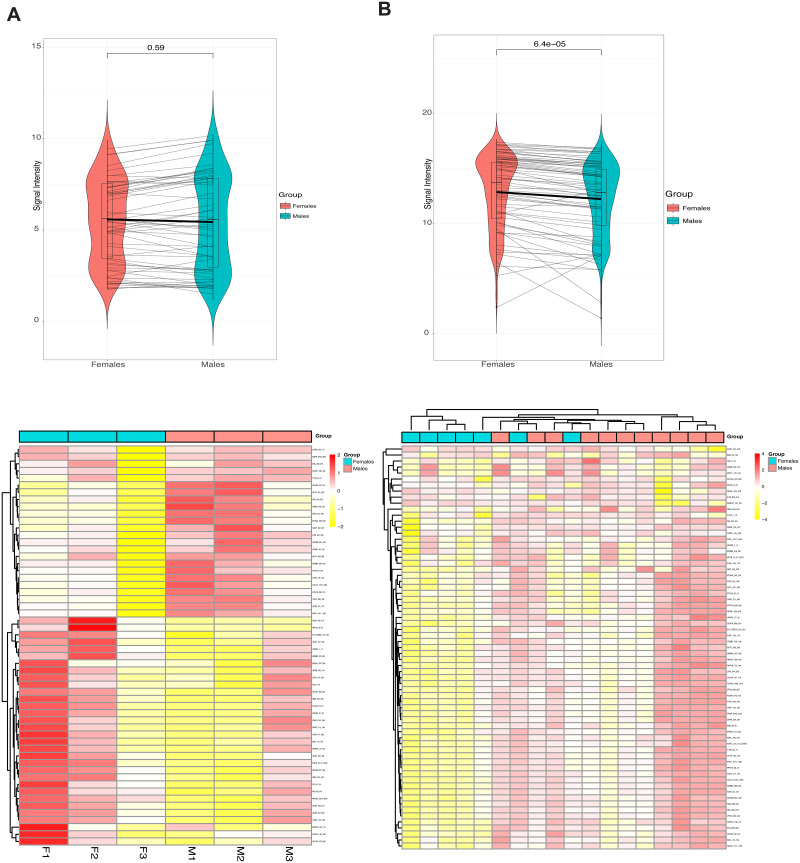
Fig 2. Global serine-threonine kinase activity in female vs. male DLPFC.
(A) Global phosphorylation plots, showing signal intensity (phosphorylation levels) at each reporter peptide, as well as the average phosphorylation values (thick line), and a Mann-Whitney test when comparing females to males. A heatmap generated by KRSA depicting the relative signal intensity at each reporter peptide for the 6 samples on the array (3 females and 3 males) (B) Global phosphorylation plots, showing signal intensity (phosphorylation levels) at each reporter peptide, as well as the average phosphorylation values (thick line), and a Mann-Whitney test when comparing females to males using 18 control samples from the HPC cohort (11 females and 7 males). To highlight differences, the heatmap is normalized per row to present relative changes at each individual peptide between the groups. Red indicates relatively higher levels of phosphorylation and yellow indicates relatively lower levels of phosphorylation.

