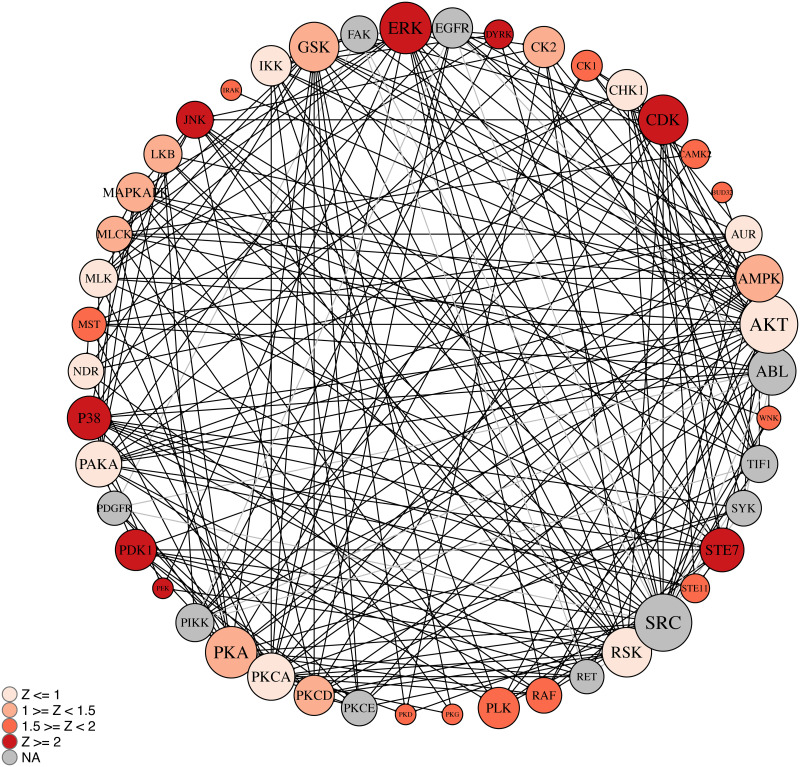
Fig 5. Kinase network model of female vs. male DLPFC.
The kinase network was obtained in KRSA by growing the kinome array hits with kinase interacting partners as identified using STRING and PhosphoSitePlus. The kinome array hits are color coded by the averaged z score values. Circle size corresponds to the number of interactions, with larger circles having more interactions. Black lines represent interactions with a kinome array direct hit, while gray represent interactions made between associated the other kinase families.

