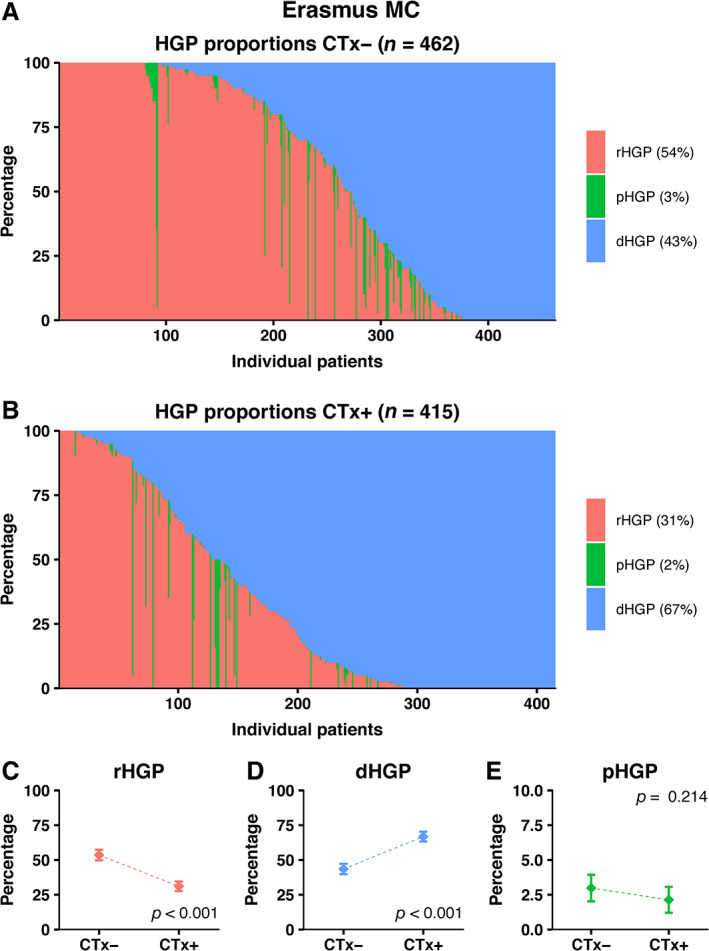
Figure 2.

Distribution of HGPs in the original cohort of the Erasmus MC Cancer Institute stratified for preoperative treatment status. (A) Distribution of HGPs in the chemo‐naïve cohort. (B) Distribution of HGPs in the preoperatively treated cohort. (C–E) Average observed proportion of replacement type HGP (C), desmoplastic type HGP (D), and pushing type HGP (E) in chemo‐naïve patients compared to preoperatively treated patients.
