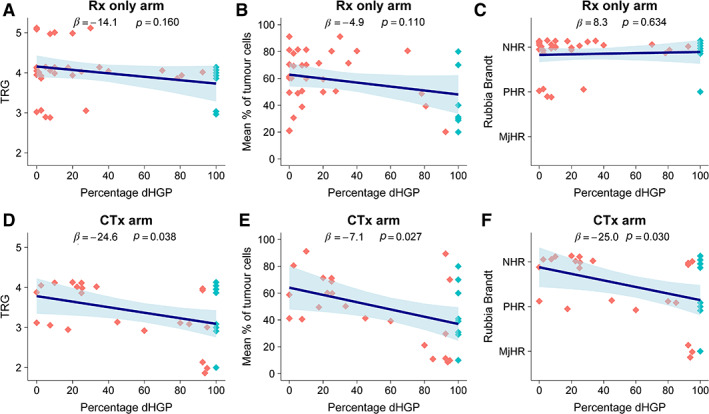
Figure 5.

(A–F) Results of the multivariable linear regression models investigating three separate gradings of tumour regression in patients randomised to either resection only (A–C) or perioperative chemotherapy with resection (D–F) within the EORTC 40983 phase III trial. The dots resemble individual patients; dark grey dots represent a non‐desmoplastic and light grey dots a desmoplastic phenotype, respectively. The regression line represents the association for one of the three tumour regression gradings with the dHGP on multivariable analysis, with the ribbon representing the 95% CI of the estimate. dHGP, desmoplastic HGP; NHR, no histological response; PHR, partial histological response; MjHR, major histological response.
