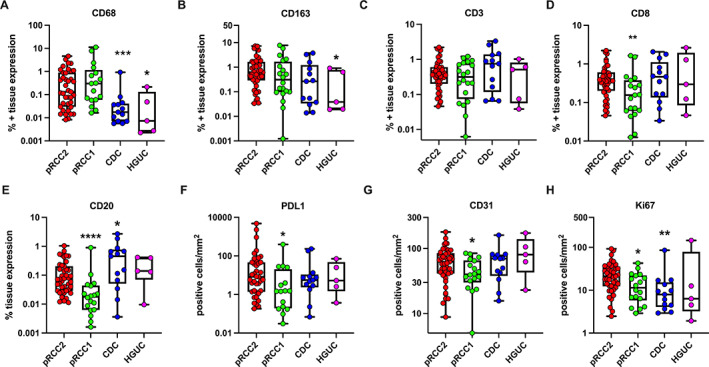
Figure 2.

Scatter plot representation of median ± range of the percentage positive tissue area for markers measured by IHC and quantified by digital pathology using the HALO image analysis platform. Data were analyzed by unpaired Mann–Whitney test for differences between individual histological types compared. pRCC2 acted as comparison group for all analysis, as it had the largest subject size. pRCC2, papillary renal cell carcinoma type 2 (n = 44) (red); pRCC1, papillary renal cell carcinoma type 1 (n = 20) (green); CDC, collecting duct carcinoma (n = 14) (blue); HGUC, high‐grade urothelial carcinoma (n = 5) (magenta). ****p < 0.0001; ***p < 0.0005; **p < 0.005; *p < 0.05.
