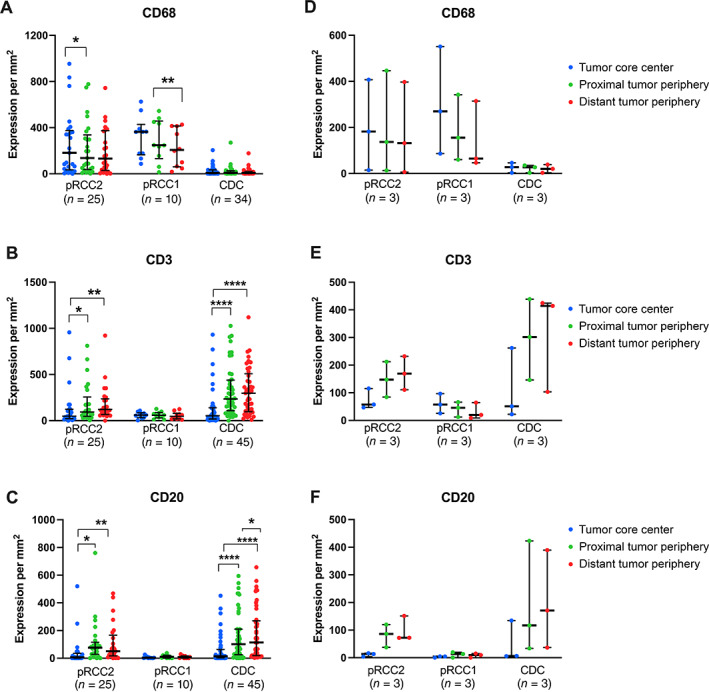
Figure 3.

Scatter plot representation of median ± IQR expression of markers inside the tumor regions; the expression of markers across a 140‐μm band at the border between tumor and adjacent normal cells; and across a 140‐μm band outside tumor regions. Figures on the left represent the marker expression in each individual tumor island region analyzed, and the figures on the right the median expression of all tumor islands analyzed per samples (i.e. tissue slides, n = 3). Images were analyzed using the HALO 3.1 imagine analysis platform. Data were analyzed by Wilcoxon matched pairs signed rank test with ‘inside tumor’ as the comparison group unless defined by a bar. ****p < 0.0001; ***p < 0.0005; **p < 0.005; *p < 0.05.
