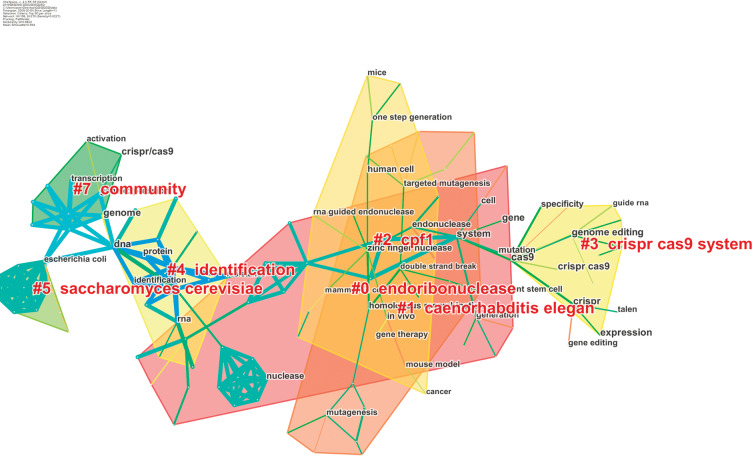
Fig. 7.
Keywords cluster map (TF-IDF): A shape represents a cluster, color means the time of the first occurrence, the color gradually changes from cool to warm, blue indicates the earlier year, red indicates the warmest color for the most recent year. The smaller the cluster tag number, the higher the number of published literature and the frequency of citation.

