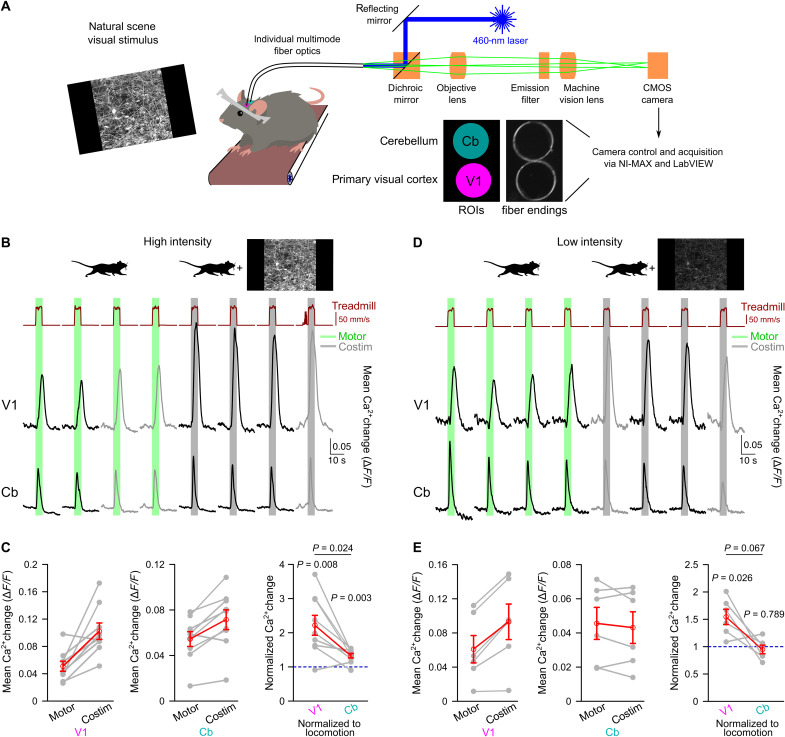
Fig. 1. Nonarousing visual stimulation region specifically potentiates vigilance-dependent V1 astrocyte Ca2+ activation.
(A) In vivo dual-site fiber photometry schematic for recording astroglia Ca2+ dynamics in cerebellum (Cb) and primary visual cortex (V1) from awake, head-fixed mice. (B) Ca2+ dynamics during enforced locomotion (green bars) or during simultaneous enforced locomotion and high-intensity (2.2 cd/m2) visual stimulation (gray bars) in V1 and Cb of Aldh1l1-CreERT2;Ai95 mice. Black traces represent mean Ca2+ responses within the regions of interest (ROIs) defined in (A). Gray traces represent voluntary locomotion contaminated trials; see Materials and Methods. (C) Left/middle: Population data of mean Ca2+ elevations from onset of locomotion to peak of locomotion or costimulation (Costim; high intensity) in V1 (left) and Cb (middle). Right: Ca2+ elevations during costimulation normalized to respective locomotion response in both regions (n = 9 mice). Gray lines, same mouse. Red symbols, means ± SEM. Repeated-measures analysis of variance (ANOVA) followed by Tukey-Kramer correction. Individual P values represent comparisons to 1 (blue dashed line), respectively. (D) Same as (B) but for low-intensity (0.3 cd/m2) visual stimulation. (E) Left/middle: Same as (C) left/middle but low intensity. Right: Same as (C) right but low intensity (n = 6 mice). Source data are provided as a source data file.

