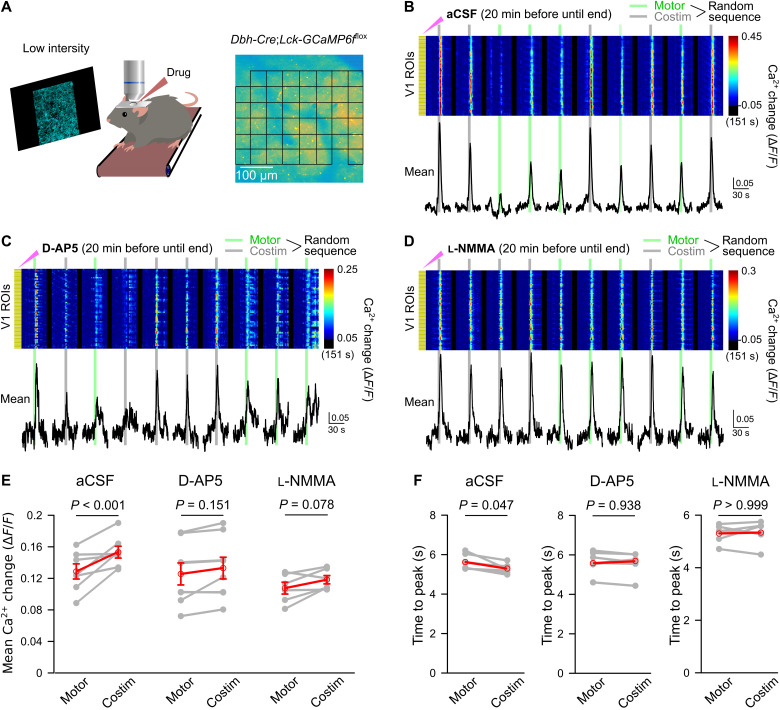
Fig. 4. NMDA receptors and NO mediate local, sensory stimulus-induced enhancement and acceleration of noradrenergic terminal Ca2+ elevations in V1.
(A) Experimental design as for Fig. 2 and pseudo-randomized stimulation as for Fig. 3. Incubation with drugs in artificial cerebrospinal fluid (aCSF) started 20 min before imaging (solution replacement every 10 min). (B) Ca2+ responses to enforced locomotion (green bars) or simultaneous enforced locomotion and blue stimulation (gray bars) in aCSF. Pseudo-colored plot represents Ca2+ changes in individual ROIs, and black traces represent mean Ca2+ change in all ROIs. (C) Same as (B) with NMDA receptor antagonist D-AP5 (1 mM). (D) Same as (B) with NOS inhibitor l-NMMA acetate (600 μM). (E) Chained-dot plot to compare mean Ca2+ change during 10 s from onset of locomotion in all noradrenergic terminal ROIs between locomotion and costimulation trials from all mice locally exposed to aCSF (left, n = 7 mice), D-AP5 (middle, n = 8 mice), and l-NMMA acetate (right, n = 6 mice). Gray lines, same mouse. Red symbols, means ± SEM. Repeated-measures ANOVA for three groups, followed by Tukey-Kramer correction. (F) Same as (E) but comparing mean time to peak. Red symbols, median. Wilcoxon signed-rank tests followed by Bonferroni correction. Source data are provided as a source data file.

