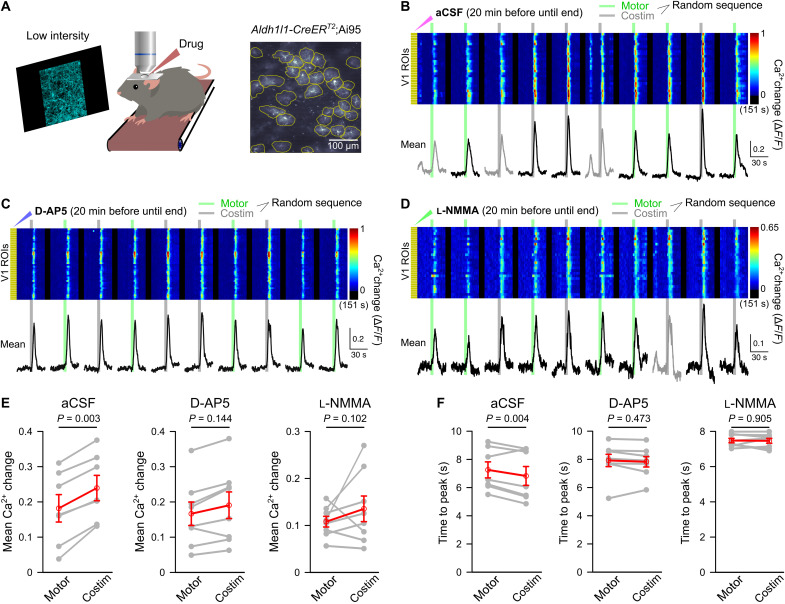
Fig. 5. Sensory stimulus-evoked potentiation of astrocyte Ca2+ elevations requires NMDA receptor activation and NO.
(A) Schematic illustrating same experimental design as described for Fig. 4 using Aldh1l1-CreERT2;Ai95 mice. (B) Ca2+ responses to enforced locomotion (green bars) or simultaneous enforced locomotion and blue stimulation (gray bars). The surface of V1 was incubated in aCSF from 20 min before until the end of the experiment (aCSF was replaced every 10 min). Pseudo-colored plot represents Ca2+ changes in individual ROIs, and black traces represent mean Ca2+ change in all ROIs. (C) Same design as (B) but incubation with NMDA receptor antagonist D-AP5 (1 mM). (D) Same design as (B) but incubation with NOS inhibitor l-NMMA acetate (600 μM). (E) Chained-dot plot to compare mean Ca2+ change during 10 s from onset of locomotion in all astrocytes between locomotion-alone and costimulation trials from all mice locally exposed to aCSF (left, n = 7 mice), D-AP5 (middle, n = 8 mice), and l-NMMA acetate (right, n = 8 mice). Gray lines connect values from the same mouse. Red symbols indicate means ± SEM. Statistical analysis used repeated-measures ANOVA for three groups, followed by Tukey-Kramer correction. (F) Same as (E) but comparing mean time to peak. Gray lines connect values from the same mouse. Red symbols indicate means ± SEM. Statistical analysis used repeated-measures ANOVA for three groups, followed by Tukey-Kramer correction. Source data are provided as a source data file.

