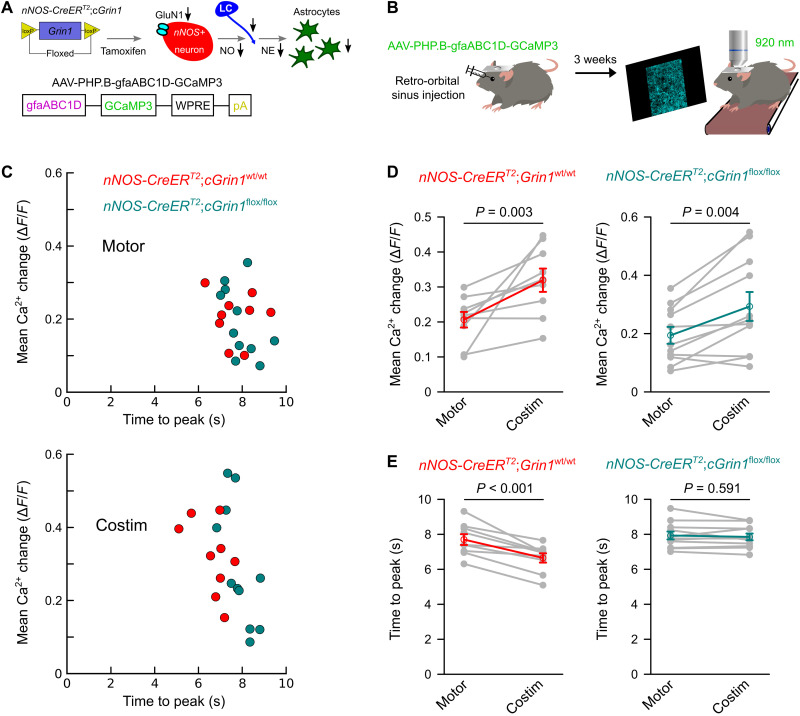
Fig. 6. Induced knockout of GluN1 receptors on nNOS+ interneurons impairs the acceleration of noradrenergic signaling by visual input.
(A) Schematic diagram of generating nNOS-CreERT2;cGrin1flox/flox mice and AAV-PHP.B-gfaABC1D-GCaMP3. (B) Schematic of viral vector delivery by retro-orbital injection for in vivo astroglia Ca2+ imaging. (C) Population data with two-dimensional plots visualizing the mean Ca2+ change (y axis) and mean time to peak (x axis) for nNOS-CreERT2;cGrin1wt/wt (red) and nNOS-CreERT2;cGrin1flox/flox (green) mice during locomotion-alone trials (Motor) and costimulation trials (Costim). (D) Chained-dot plot to compare mean Ca2+ change between locomotion-alone and costimulation trials in nNOS-CreERT2;cGrin1wt/wt and nNOS-CreERT2;cGrin1flox/flox mice [n = 9 fields of view (FOVs) from three mice and n = 11 FOVs from four mice, respectively]. Gray lines connect values from the same mouse. Red and green symbols indicate means ± SEM. Statistical analysis used repeated-measures ANOVA for two groups, followed by Tukey-Kramer correction. (E) Same as (D) but comparing mean time to peak. Gray lines connect values from the same mouse. Red and green symbols indicate means ± SEM. Statistical analysis used repeated-measures ANOVA for two groups, followed by Tukey-Kramer correction. Source data are provided as a source data file.

