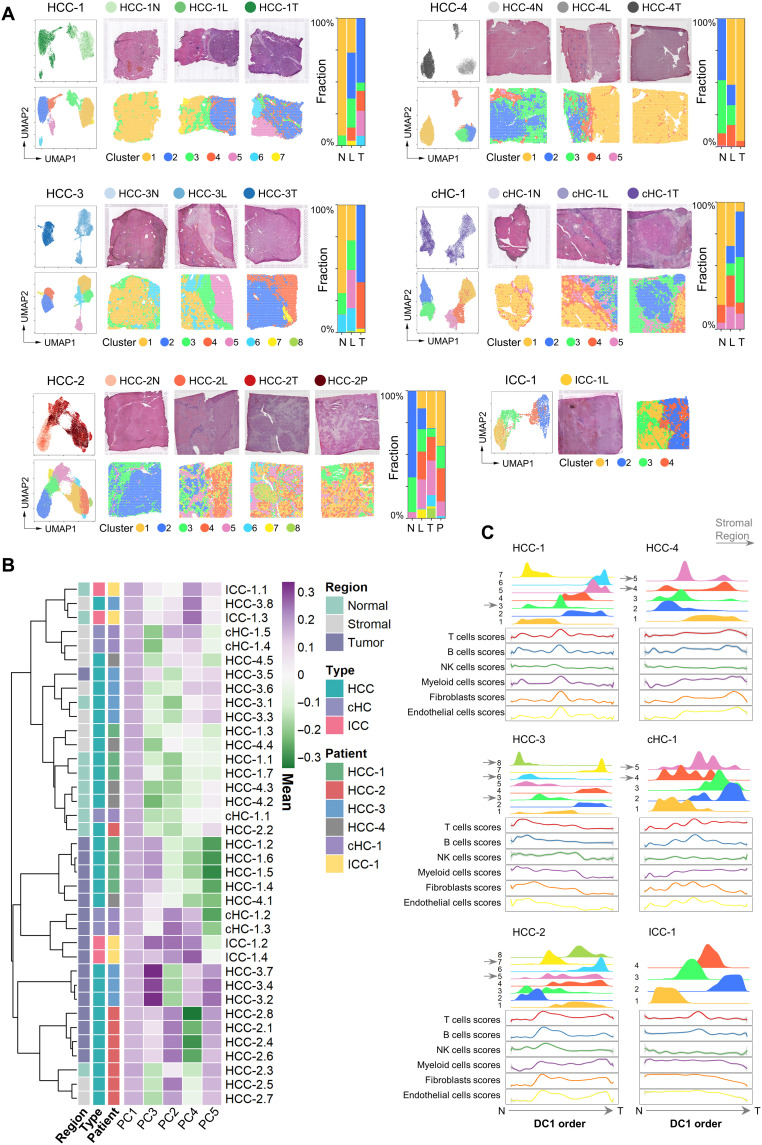
Fig. 2. Different patterns of PLC spatial heterogeneities.
(A) Left: For each patient: UMAP of the spots colored by their section sources (top) and cluster identities (bottom), respectively. Middle: H&E staining (top) and the spatial cluster distribution (bottom) of each section in order of N/L/T/P. Right: Fraction of clusters in each section. (B) Similarity comparison of the clusters across different patients. The clusters’ tissue regions, histopathological types, and patient information were annotated on the left. HCC-1.1 represented the cluster 1 of HCC-1. The clusters’ normal, stromal, and tumor region labels were annotated according to the expression profile of marker genes and the corresponding tissue types in H&E image. (C) Distribution of the clusters (top half plot of each patient; y axis, the cluster’s density) and the main stromal and immune cell type scores (bottom half plot; y axis, the fitted cell type enrichment score) along the direction of the first diffusion map component (DC1 order, the shared x axis).

