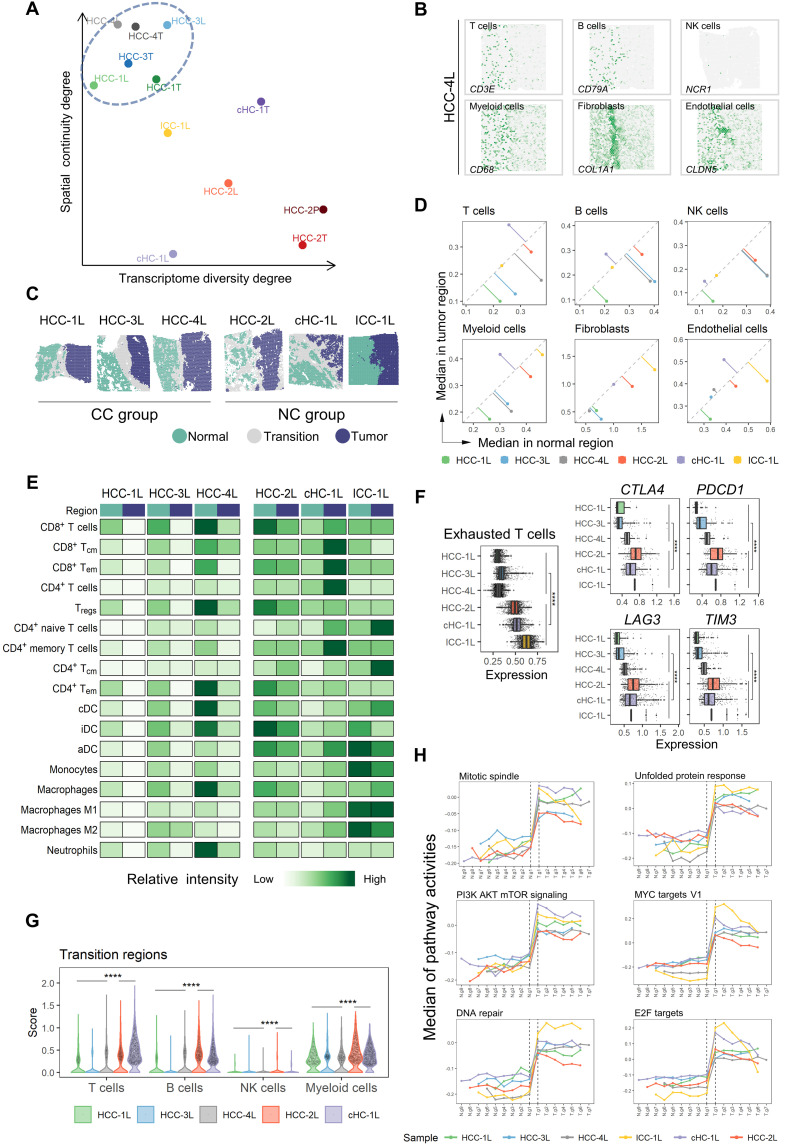
Fig. 3. Microenvironment characteristics in leading-edge area.
(A) Transcriptome diversity degree and spatial continuity degree of tumor regions in L/T/P sections. (B) Spatial feature plots of six marker genes of stromal and immune cell types in HCC-4L. (C) Distribution of normal, tumor, and transition regions in L section and the grouping results of the CC (complete capsule) group and NC (non- or discontinuous capsule) group. (D) Comparison of the median of stromal and immune cell type scores between the normal (x axis) and the tumor (y axis) regions in each L section. (E) Comparison of the relative intensity (each row shared a color scale, while different rows did not) of stromal and immune cell subtype scores between the normal and tumor regions in each L section. iDC, interdigitating dendritic cell; aDC, active dendritic cell. (F) Comparison of the expression levels of exhausted T cell signature, CTLA4, PDCD1, LAG3, and TIM3, between the CC and NC groups. Two-sided Wilcoxon rank sum tests on the CC and NC groups were used to analyze the significance of their differences. ****P < 0.0001. (G) Comparison of the immune cell scores in the “transition regions” between the CC and NC groups. One-sided Wilcoxon rank sum tests (the CC group was less than NC group) were used to calculate the statistical significance. ****P < 0.0001. (H) Changes of hallmark pathways’ activities along with the gradient divisions on both sides of the transition region. Each dot indicated the median of the pathway activity in the corresponding area. PI3K, phosphoinositide 3-kinase; mTOR, mammalian target of rapamycin.

