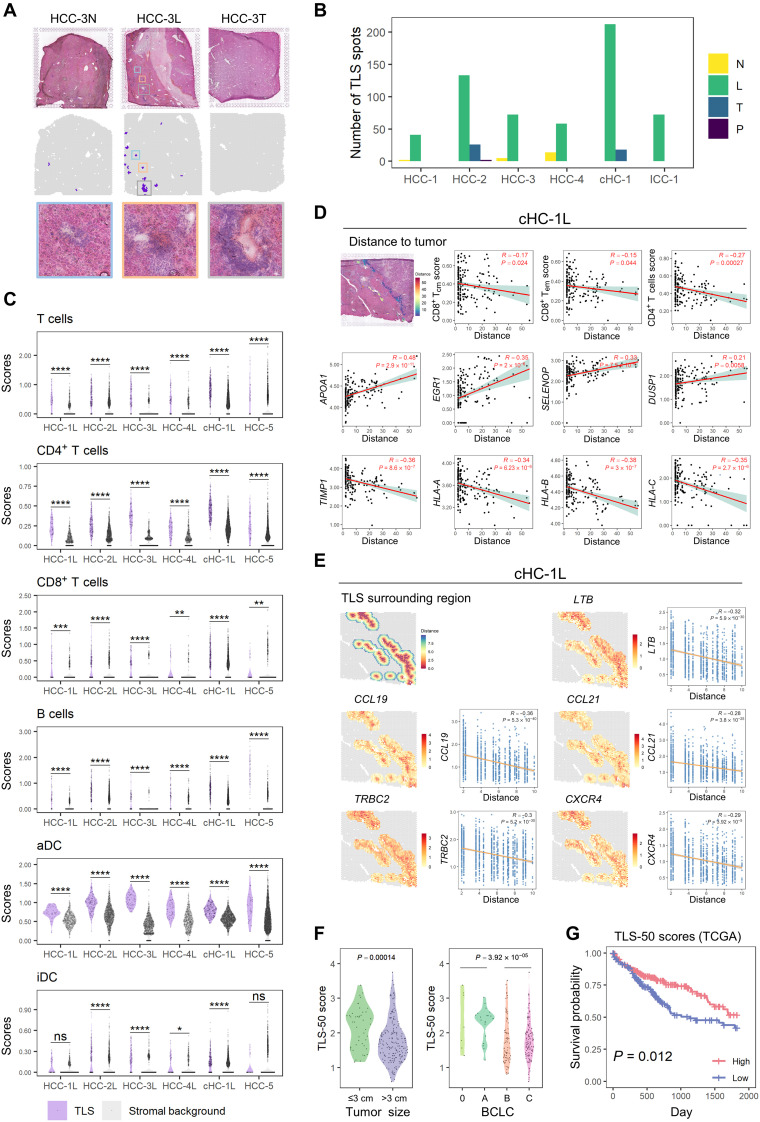
Fig. 7. Spatial distribution and clinical significance of TLS.
(A) TLSs identified by TLS-50 signature and their corresponding H&E staining images in HCC-3. (B) Bar plot showing the distribution of the identified TLS spots in the different sections of each patient. (C) Violin plots showing the signature difference of immune cell type scores in the TLSs and their surrounding stromal backgrounds. Statistical significances were determined by two-sided Wilcoxon rank sum tests. *P < 0.05; **P < 0.01; ***P < 0.001; ****P < 0.0001. (D) Scatter plots showing the correlation between the cell type enrichment degrees or gene expression levels of TLS spots and their distances to tumor regions in cHC-1 L. These distances were presented at the H&E staining (the first subplot). Linear regression and Pearson correlation were used to measure the relation. (E) Spatial plots showing the surrounding regions (five spots wide) of TLSs in cHC-1 L, which were colored by the distances to TLS spots or some genes’ expression profiles. Scatter plots showing the correlation between these genes’ expression levels and the distances to TLS spots. Linear regression and Pearson correlation were used to measure the relation. (F) Violin plots showing the distribution of TLS-50 scores of the bulk sequencing data of 239 HCC cases, which were grouped by tumor sizes (left) and BCLC stages (right), respectively. (G) Survival curves of cases with high (top 50%) and low (bottom 50%) TLS-50 signature scores in TCGA cohorts. Log-rank test was used to measure the statistical significance.

