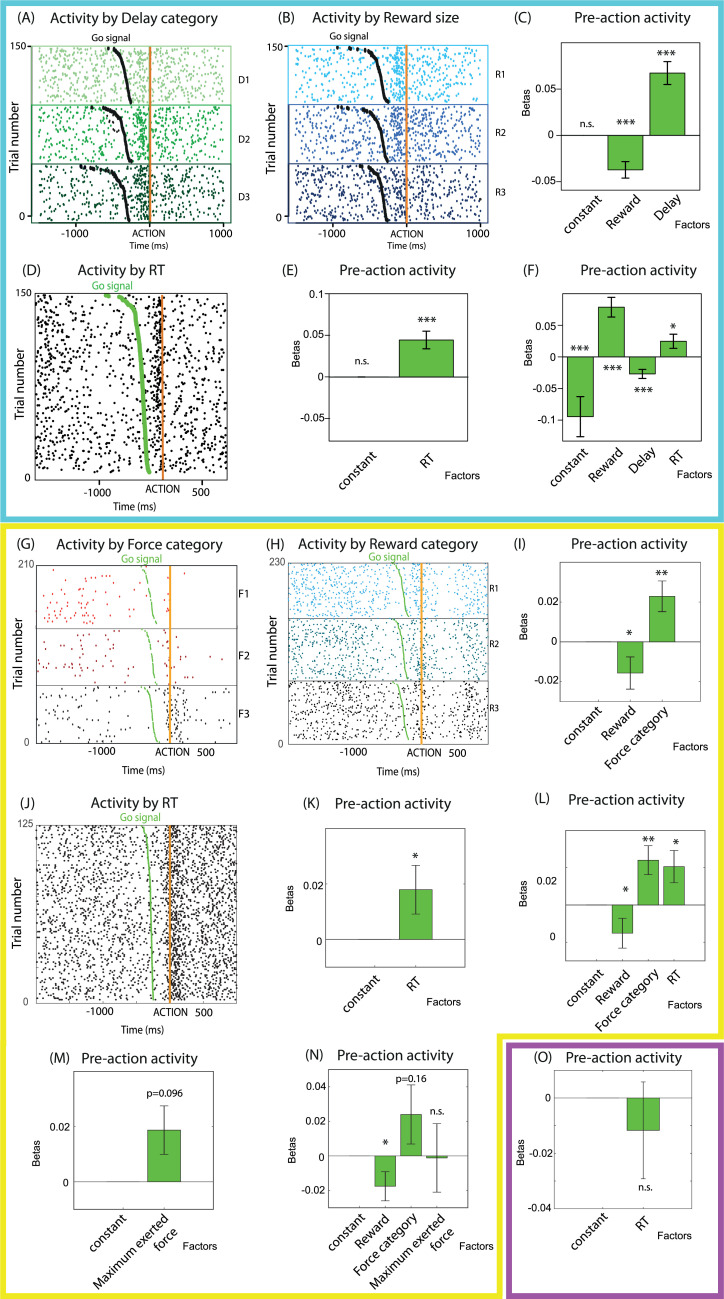
Fig 4. Encoding of proxies for cognitive effort to trigger the action and physical effort to execute it, before action onset in (A–F) the delay discounting task, (G–M) the force discounting task, and (N) the target detection task.
(A, B) Raster plots of the activity of 2 representative LC units encoding task parameters (delay, (A) and reward, (B)) recorded in the delay discounting task, around action onset (orange vertical line). Green dots represent the go signal. Trials are split by (A) delay levels (D1,2,3) or (B) reward size (R1,2,3). Unit (A) encoded delay positively before action onset, i.e., was more active before action onset in high-delay conditions. Unit (B) encoded reward negatively, i.e., was less active before action onset in high-reward conditions. (C) Summary (mean and SEM) of the coefficients of the neuron-by-neuron GLMs for spike count before action onset with reward and delay as parameters, in the delay discounting task. Across the population, neurons encoded reward negatively and delay positively. (D) Raster plot of the activity of a representative LC unit encoding RT positively around action onset (orange line) in the delay discounting task. This unit was more active when RT (interval between go signal, green dot, and action onset) was longer. (E, F) Summary (mean and SEM) of the coefficients of the neuron-by-neuron GLMs for spike count before action onset with (E) RT alone or (F) RT, reward, and delay as parameters in the delay discounting task. (E) Across the population, neurons encoded RT positively, (F) and this positive encoding was true over and above the encoding of reward (negatively) and delay (positively). (G-H) Raster plots of the activity of 2 representative LC units encoding task parameters (force category, (G) and reward, (H)) recorded in the force discounting task, around action onset (orange vertical line). Green dots represent the go signal. Trials are split by (G) force levels (F1,2,3) or (H) reward size (R1,2,3). Unit (G) encoded force positively before action onset, i.e., was more active before action onset in high-force conditions. Unit (H) encoded reward negatively, i.e., was less active before action onset in high-reward conditions. (I) Summary (mean and SEM) of the coefficients of the neuron-by-neuron GLMs for spike count before action onset with reward and force category as parameters, in the force discounting task. Across the population, neurons encoded reward negatively and force category positively. (J) Raster plot of the activity of a representative LC unit encoding RT positively around action onset (orange line) in the force discounting task. This unit was more active when RT (interval between go signal, green dot, and action onset) was longer. (K, L) Summary (mean and SEM) of the coefficients of the neuron-by-neuron GLMs for spike count before action onset with (K) RT alone or (L) RT, reward, and force category as parameters, in the force discounting task. (K) Across the population, neurons encoded RT positively, (L) and this positive encoding was true over and above the encoding of reward (negatively) and force category (positively). (M, N) Summary (mean and SEM) of the coefficients of the neuron-by-neuron GLMs for spike count before action onset with (M) the maximum exerted force on the grip alone or (N) the maximum exerted force on the grip, reward and force category as parameters, in the force discounting task. (M) Across the population, neurons marginally encoded the maximum exerted force, (N) but this effect was not present over and above effects of task parameters (force category and reward). (O) Summary (mean and SEM) of the coefficients of the neuron-by-neuron GLMs for spike count before action onset, with RT as parameter, in the target detection task. Across the population, neurons did not encode RT. *: p < 0.05; **: p < 0.01; ***: p < 0.001; n.s., nonsignificant. Underlying data in 10.17605/OSF.IO/PYVSA. D, delay; F, force; GLM, generalized linear model; LC, locus coeruleus; R, reward; RT, response time; SEM, standard error of the mean.

