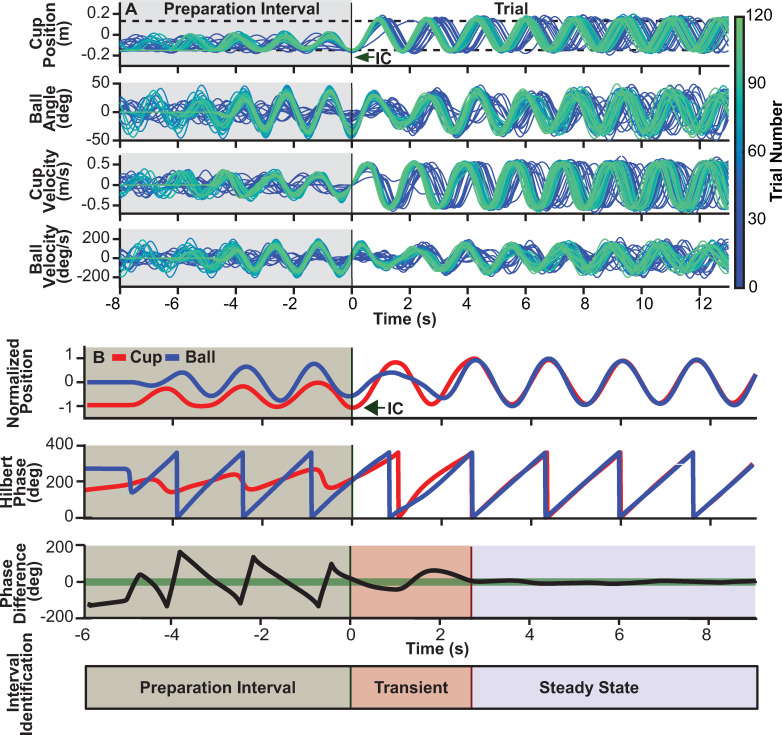
Fig 2. Object kinematics and transient calculation.
A. Kinematics of the cup and ball of one sample subject: cup position, ball angle, cup velocity, and ball velocity. The panels show 60 trials (every other trial, with the sequence indicated by the color gradient). The dashed black lines in the top panel with cup position show the instructed cup amplitude, defined by the centers of Box A (-0.15m) and Box B (0.15m). The time series were aligned at the moment of trial initiation when the cup velocity was at its last zero prior to reaching Box B for the first time and starting the regular rhythmic movement. Initial conditions (IC) of all four variables were determined at this time point. B. Top panel shows cup position normalized to ±1 and ball angle similarly normalized between ±1. Calculation of relative phase between cup and ball trajectories to parse each trial into a transient and a steady state portion. To demarcate the end of the transient and start of the steady state, the instantaneous phase differences between cup and ball position were computed for the entire trial using the Hilbert Transform. The time point when the phase difference entered and remained within a threshold shown by the thick green line (27 deg or ±15% of the maximum phase difference of 180 deg) defined the end of the transient and start of the steady state.

