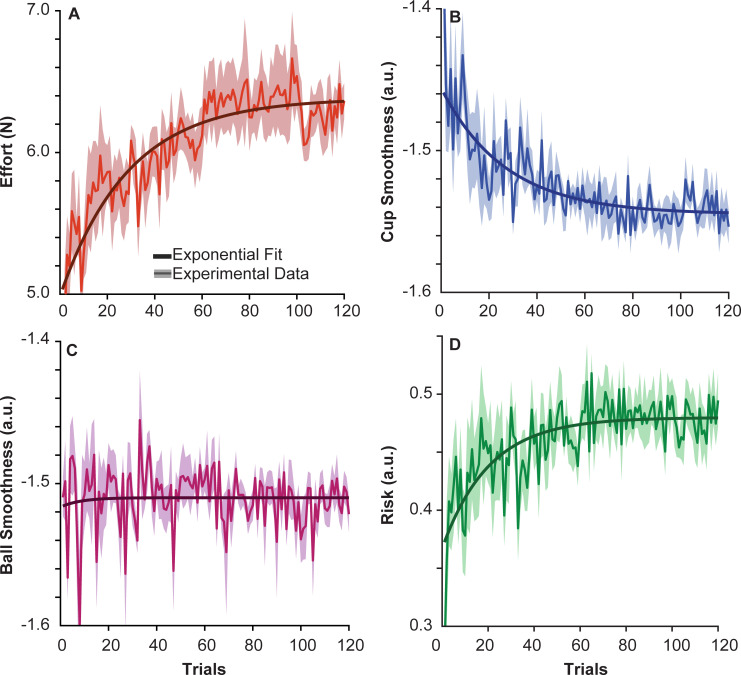
Fig 7.
Subject performance measured by effort, smoothness and risk metrics: A. Root mean square (RMS) of Finter, a measure of effort, across subjects and trials. The solid red line shows the mean across subjects; the shading shows the standard error of the mean. The trend in the data was fit with: A = 1.396, τ = 28.76, B = 4.987, and R2 = 0.80. B. Smoothness of the cup trajectory quantified by the SPARC method averaged across subjects over 120 trials. The trend in the data was fit with: A = 0.108, τ = 19.44, B = -1.650, and R2 = 0.71. Note that larger negative numbers indicate less smooth kinematics C. Smoothness of the ball kinematics calculated using the SPARC method averaged across subjects over the experiment is shown in magenta. The trend in the data was fit with: A = -0.007, τ = 8.44, B = -1.5, and R2 = 0.003. D. Risk quantified as (1-energy margin); decreasing energy margin is expressed as increasing risk. The average risk across subjects over trials is shown by the solid line. The data was fit with the same exponential function: A = 0.086, τ = 23.32, B = 0.295, and R2 = 0.46.

