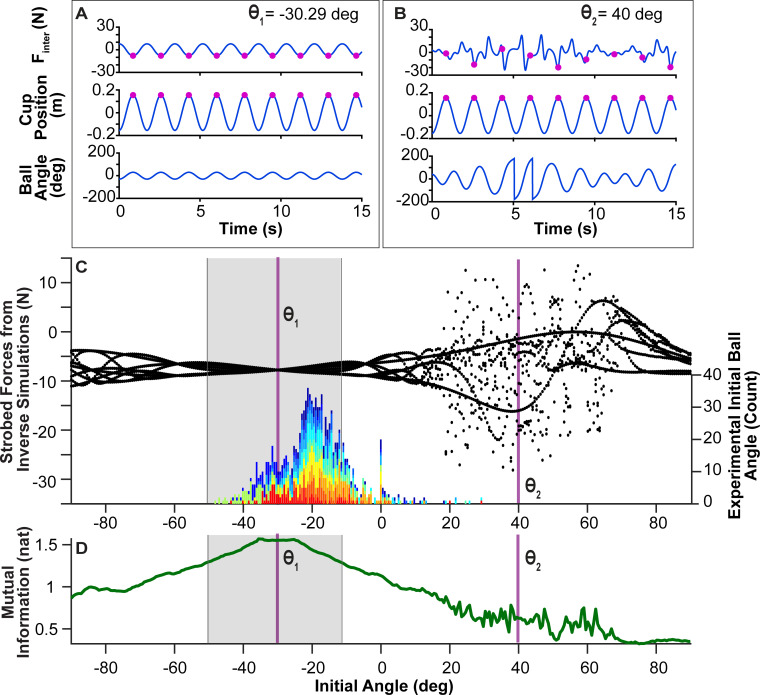
Fig 8.
Effect of initial ball angle on interaction forces: A. Simulated interaction force Finter(t), cup position x(t), and ball angle θ(t), for rhythmic cup displacement starting with θ1 = −30.29 deg and = −15.81 deg/s, the average initial ball velocity at the end of the experiment across all subjects. The cup frequency and amplitude were set to experimental averages 0.58 Hz and 0.308 m (peak-to-peak). B. Simulated interaction force Finter(t), cup position x(t), and ball angle θ(t), for a trial initiated with θ2 = 40 deg. The initial values for , cup frequency and amplitude were the same as in panel A. C. Distribution of strobed force Finter(t) for all initial ball angles: At every maximum of x(t), the value of Finter(t) was determined, as displayed by the magenta points at each peak of x(t). The marginal distributions of the strobed force profiles are plotted against the respective initial ball angle θ0 between -90 deg and +90 deg (the step size was 5 deg). θ1 and θ2 are marked with vertical lines. The gray box overlaid onto the figure denotes the range of initial ball angles for which the simulated ball position data remained below ± 50 deg, i.e. the ball did not escape. The figure also includes a histogram of experimental values of θ0 for all trials pooled over all subjects; different subjects appear in different colors. The mode of the distribution of the experimental data was at -22.68 deg. D. Mutual information (MI) between the simulated Finter(t) profile and the cup kinematics for each θ0. Higher MI values indicates higher degrees of predictability. The initial ball angles that produce the highest MI values align with the θ0 that produce the least complex distributions of the strobed Finter(t).

