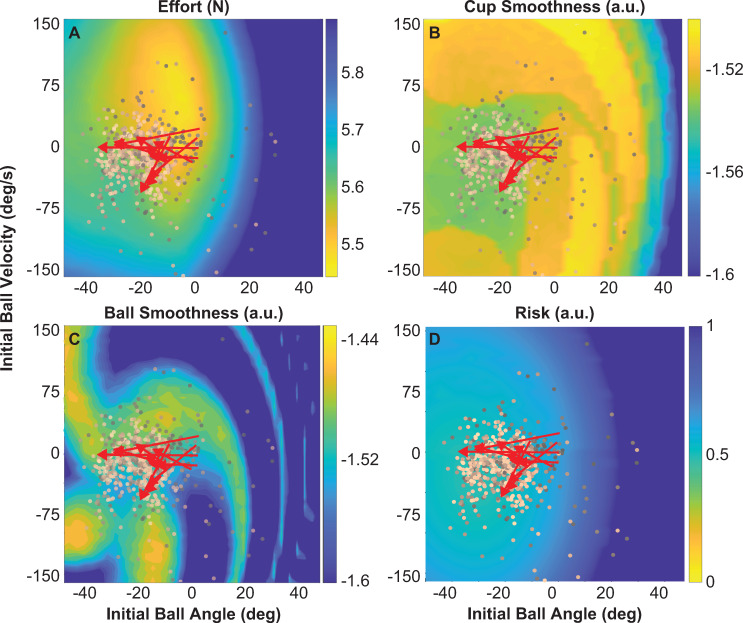
Fig 10.
Predicted effect of initial ball states on effort, smoothness and risk metrics: Simulated metrics generated by forward simulations using an impedance controller for different initial ball angles and velocities. The impedance parameters were: K = 40 N/m and B = 40 Ns/m; the cup frequency was fixed at 0.58 Hz for all simulations. In all simulated maps experimental data of ball angles and velocities from all 1100 successful trials are overlaid; darker colors indicate early trials and lighter colors show later trials. For each subject, the means of the first 5 trials and the last 5 trials are connected and shown by red arrows. A. Effort expressed as RMS of Finter(t). B. Simulated cup smoothness values calculated for different initial ball angles and initial ball velocities. C. Simulated ball smoothness values calculated for different initial ball angles and initial ball velocities. D. Risk or the inverse of energy margins. In all simulations, yellow indicated the desired regions.

