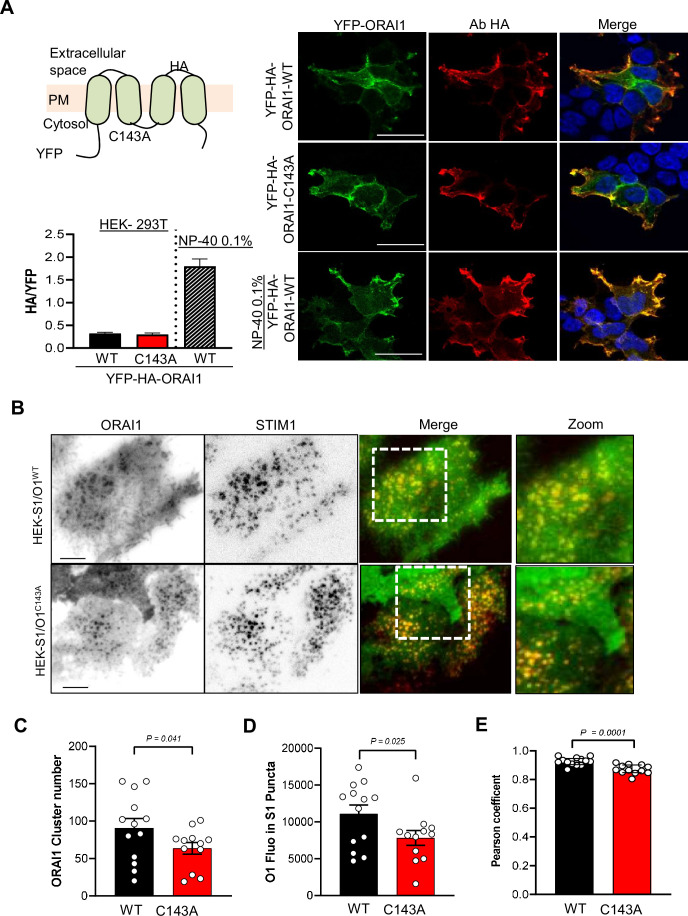
Figure 3. Preventing ORAI1 S-acylation reduces channel clustering and affinity for lipid rafts.
(A) Cartoon of the YFP-HA-ORAI WT or C143A constructs with HA exposed extracellularly between TM3 and TM4. HEK-293 cells transiently expressing the indicated constructs were stained for HA in non-permeabilising conditions to decorate the ORAI1 PM fraction. Graph bars represent the mean ± SEM of 15 (WT), 17 (C143A) and 10 (WT+ NP-40) cells. Right, Representative confocal images of YFP (green) and HA (red) staining in the indicated conditions. Scale bar = 25 µm. (B) Representative TIRF images of WT and C143 O1/S1 cells exposed to 10 µM CPA for 10 min to induce mCh-STIM1 and ORAI1-YFP clustering. Bars = 5 µm. (C–E) Quantification of ORAI1-YFP clusters numbers (C), of the average ORAI1-YFP fluorescence inside STIM1 clusters (D), and of the Pearson’s co-localisation coefficient between mCh-STIM1 and ORAI1-YFP (E) 10 min after CPA exposure. Data are mean ± SEM of 13 (WT) and 12 (C143A) cells from three independent experiments. (C, E) Two-tailed unpaired Student’s t-test. (D) One tailed.
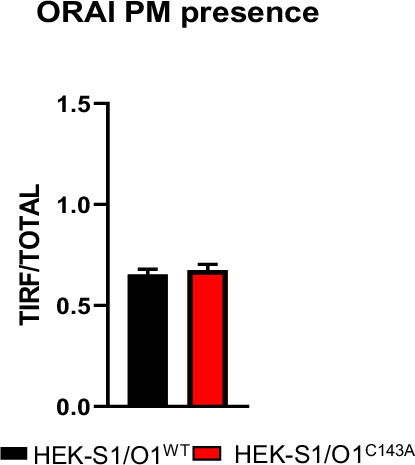
Figure 3—figure supplement 1. Fractional TIRF vs. total ORAI1-YFP fluorescence of WT and C143A O1/S1 cells.


