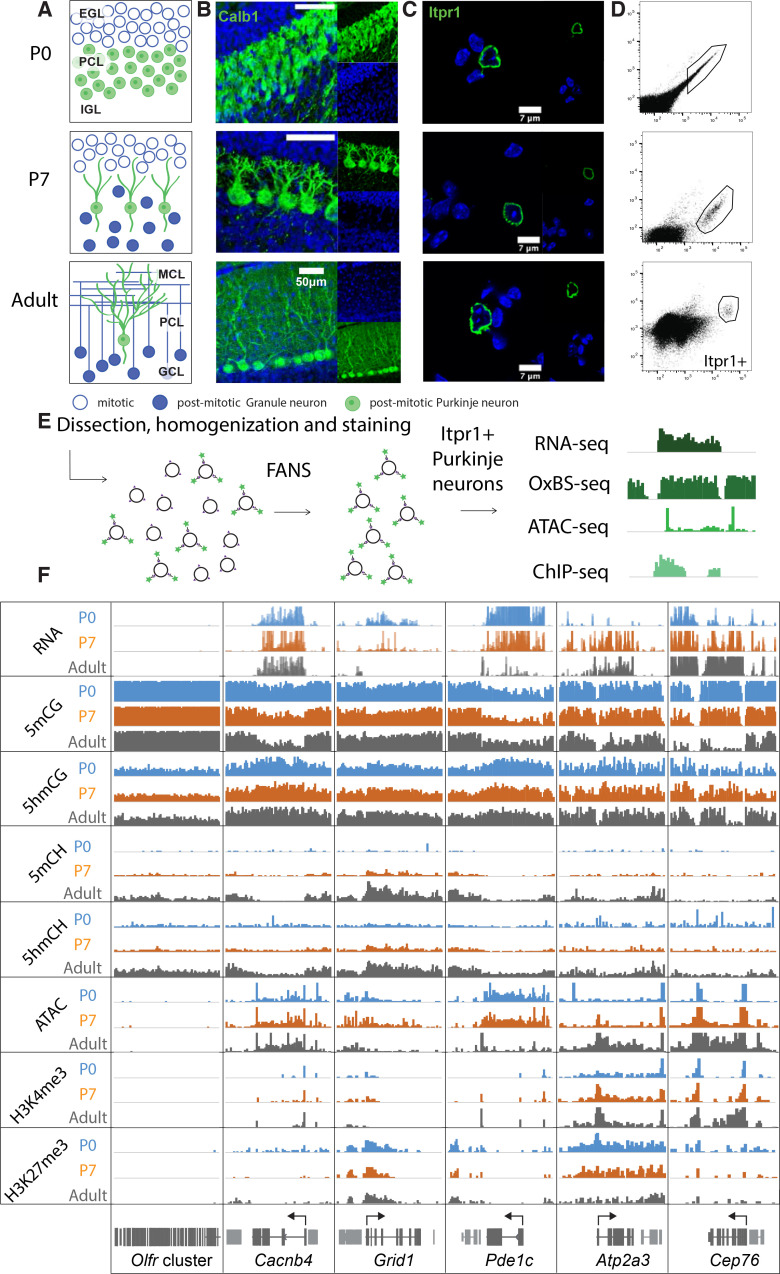
Figure 1. Chromatin landscape in differentiating Purkinje neurons.
(A) Schematic of Purkinje cell (PC) differentiation and growth at P0, P7, and adult (approximately 8-week-old) timepoints. EGL – external granule layer, PCL – Purkinje cell layer, IGL – internal granule layer, MCL – molecular cell layer, GCL – granule cell layer. (B) Immunofluorescence staining with Calb1 (green) of PCs in murine cerebella at P0, P7, and adult timepoints. (C) Example of PC nuclei stained with Itpr1 (green) post-dissociation and pre-sorting, counterstained with DAPI. (D) Representative plots of fluorescence-activated nuclear sorting of PCs at P0, P7, and adult timepoints with Itpr1. (E) Workflow schematic of nuclei isolation, antibody staining with anti-Itpr1, fluorescence-activated sorting, and downstream sequencing applications. (D) Integrated genome viewer (IGV) representation of example regions of differentially regulated genes (Olfr cluster – always silent, Cacnb4 – always expressed, Grid1 and Pde1c – developmentally down-regulated, Atp2a3 and Cep76 – developmentally up-regulated). Top tracks show RNA expression in RPKM (reads per kilobase per million mapped reads), mCG tracks show methylation level in CG context from 0 to 0.8, hmCG tracks show hydroxymethylation level in CG context from 0 to 0.45, mCH and hmCH show methylation and hydroxymethylation level in CH context (H = A, C, or T) from 0 to 0.04. ATAC tracks show ATACSeq read density in RPKM from 0 to 10. H3K4me3 tracks show input normalized enrichment in RPKM from 0 to 5. H3K27me3 tracks show input normalized enrichment in RPKM from 0 to 3.


