. 2021 Nov 22;10:e71513. doi: 10.7554/eLife.71513

Figure 1. Fraction of methylated CpG sites that are polymorphic for a transition, by sample size.

The combined dataset encompasses three non-overlapping data sources: gnomAD (v2.1), the UK Biobank (UKB), and the DiscovEHR cohort. ‘European’ samples include the populations designated as ‘EUR’ in 1000 Genomes, ‘Non-Finnish European’ subsets of exome and whole genome datasets in gnomAD, as well as the UK Biobank and DiscovEHR, which have >90% samples labeled as of European ancestry.

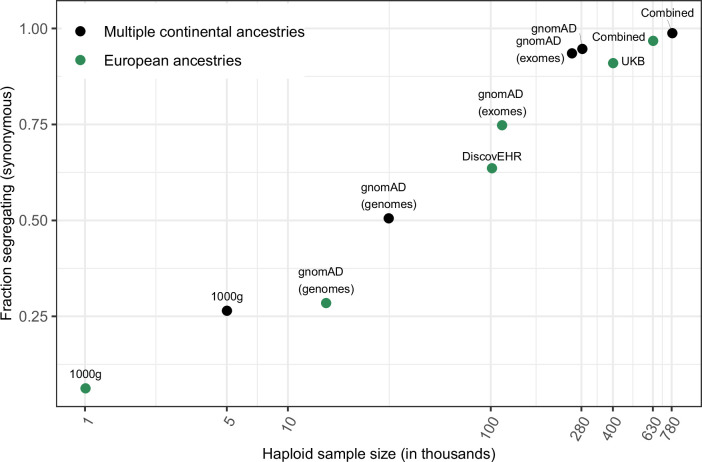
Figure 1.

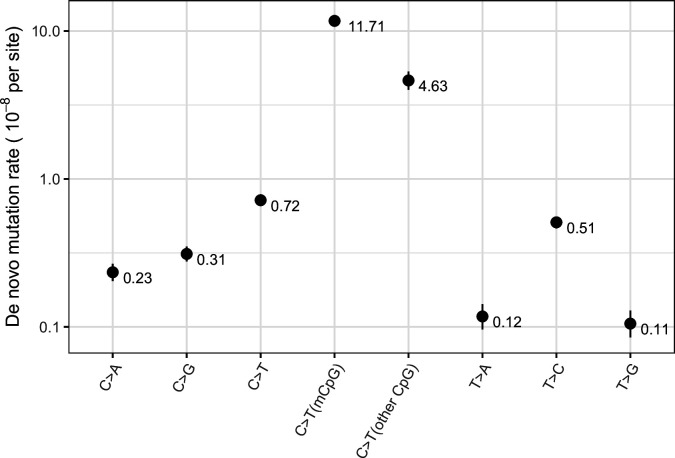
Figure 1—figure supplement 1. Exonic de novo mutation rates per generation per site estimated from a sample of 2976 parent-offspring trios data from Halldorsson et al., 2019, by mutation type.

Figure 1—figure supplement 1.

‘mCpG’ refers to a CpG site with methylation level ≥65 % in both testes and ovaries, and ‘other CpG’ to a CpG site with methylation level <65% in either testes or ovaries. Error bars reflect the 95 % Poisson confidence interval around mutation counts for each type.
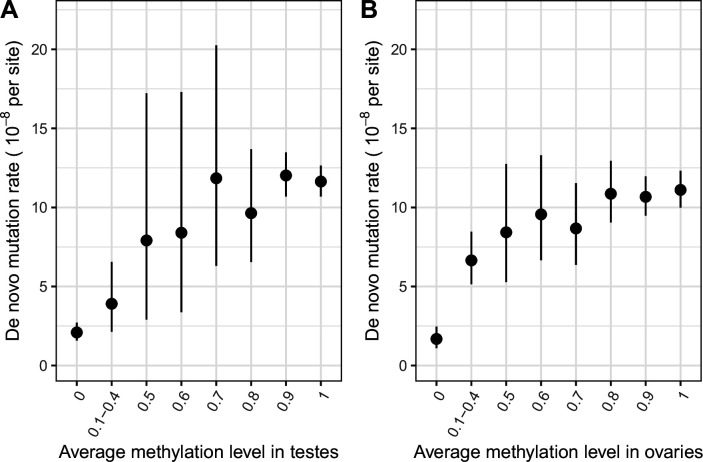
Figure 1—figure supplement 2. De novo mutation rate in exons in a sample of 2976 parent-offspring trios, by average methylation levels.

Figure 1—figure supplement 2.

(a) De novo mutation rate by average methylation levels in testes (b) De novo mutation rate by average methylation levels in ovaries. Error bars reflect the 95 % Poisson confidence interval around mutation counts in each group (the minimum number of DNMs in each bin is 5).
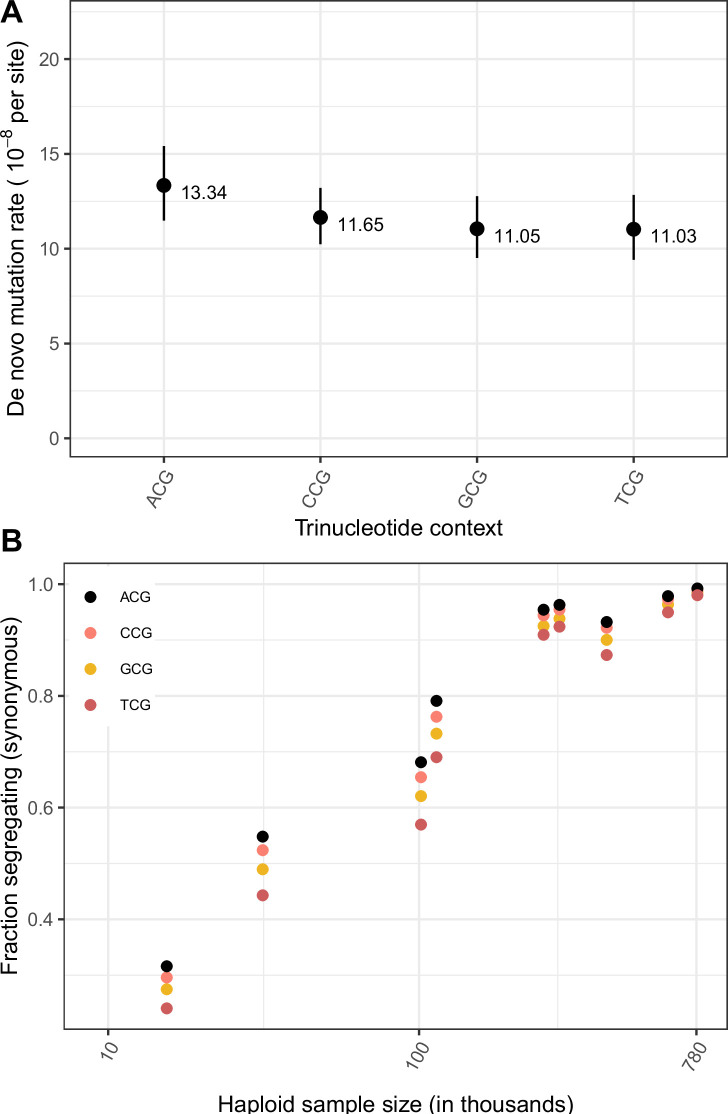
Figure 1—figure supplement 3. Effect of trinucleotide context on mutation rate and mutation saturation at methylated CpG sites.

Figure 1—figure supplement 3.

(a) Exonic de novo mutation rates at methylated CpG sites, by trinucleotide context. Error bars reflect the 95% Poisson confidence interval around mutation counts for each context. (b) Fraction of possible synonymous C > T mutations at methylated CpG sites that are observed in a sample of given size, by trinucleotide context.
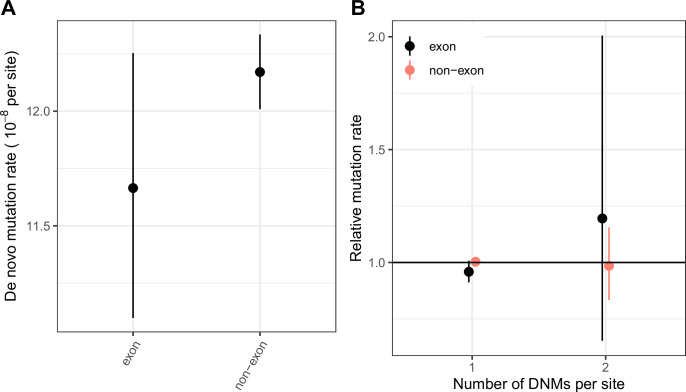
Figure 1—figure supplement 4. Comparing the distribution of CpG transition rates at methylated sites within and ouside exons.

Figure 1—figure supplement 4.

(a) DNM rates for CpG transitions at methylated sites in exons (exonic regions obtained from Gencode V19; see Materials and methods) vs. non-exons, with 95 % Poisson confidence intervals. (b) The rate of single hits (one DNM at a site) and double hits (two DNMs at a site) in exons vs non-exons, rescaled to the average rate of single and double hits in the genome, with 95 % Poisson confidence intervals.