. 2021 Nov 22;10:e71513. doi: 10.7554/eLife.71513

Figure 3. Comparing the fraction of sites observed and expected to be segregating under neutrality, by mutation type and sample size.

(a) Fraction of possible synonymous C > T mutations at CpG sites methylated in the germline and at all other C sites, and the fraction of possible synonymous T > A mutations that are observed in a sample of given size. (b) Fraction of sites segregating in simulations, assuming neutrality, a specific demographic model and a given mutation rate (see Materials and methods).

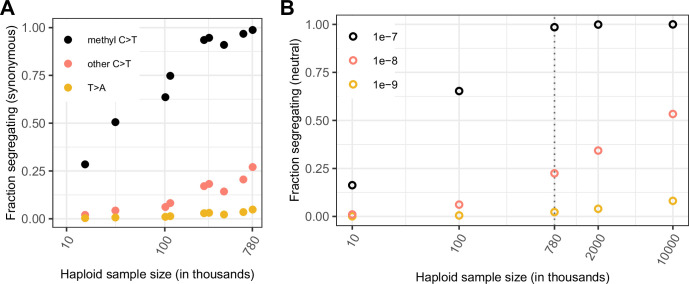
Figure 3.

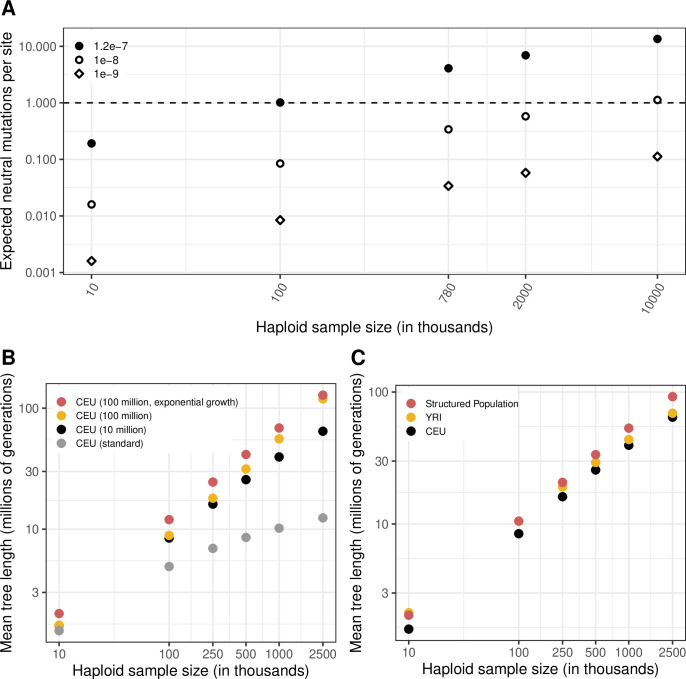
Figure 3—figure supplement 1. The expected length of the genealogy under different demographic models and for varying sample sizes.

Figure 3—figure supplement 1.

(a) The expected number of neutral mutations at a site, for three mutation rates and varying sample sizes, calculated as the expected length of the genealogy (sum of branch lengths, averaged over 20 simulations) multiplied by the mutation rate, for a CEU population with a recent Ne of 10 million for the last 50 generations (see Materials and Methods). (b) A comparison of mean genealogy lengths for the standard Schiffels-Durbin demographic model for a CEU population and three variations with increased current Ne, namely, CEU demographic history for 50,000 generations with a recent Ne of 10 million or 100 million for the last 50 generations, and CEU demographic history with 4.5 % exponential growth for the past ~200 generations. (c) A comparison of mean genealogy lengths for samples from YRI and CEU populations, and samples from a structured population derived from an ancestral population 2000 generations ago.
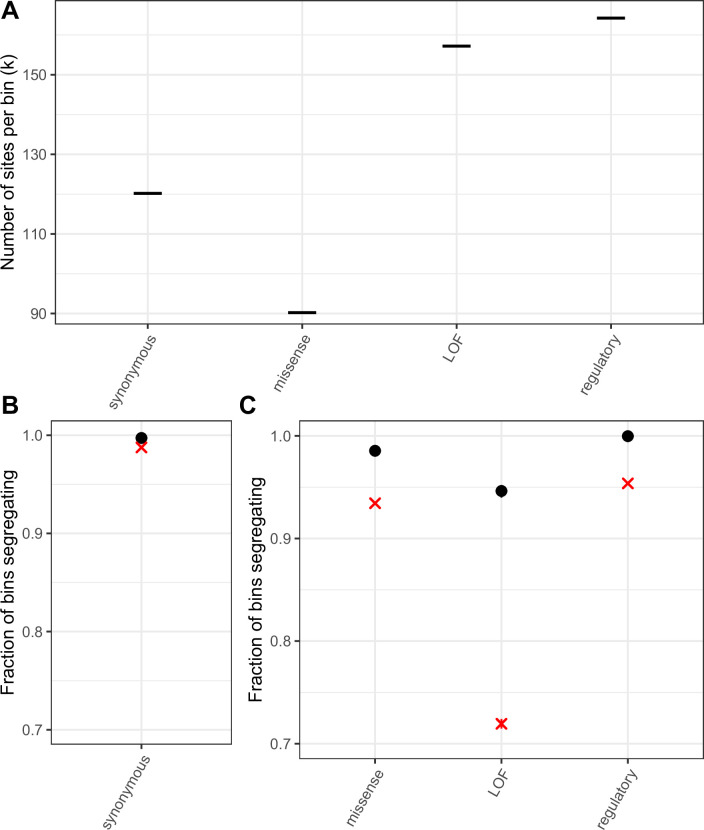
Figure 3—figure supplement 2. Mutation saturation in bins of sites compared to single mCpG sites.

Figure 3—figure supplement 2.

(a) k, the number of T sites per bin, such that the average T > A mutation rate per bin is the same as the average transition rate at a single methylated CpG site in that annotation (b) Fraction of bins of synonymous T sites that have at least one T/A polymorphism. A cross is indicated for the corresponding fraction at synonymous methylated CpG sites. As expected if synonymous sites are neutral and the mutation rate for a bin matches that of methylated CpGs, the two fractions are very similar. (c) Fraction of bins that have at least one T/A polymorphism, by non-synonymous annotation. A cross is indicated for the corresponding fraction at methylated CpG sites. Error bars are 95 % confidence intervals assuming the number of segregating bins is binomially distributed. For bins including sites under selection the fractions for CpG sites and other mutation types are not expected to match, depending on the extent of variation in mutation rates and fitness effects across sites within a bin (see Materials and methods).