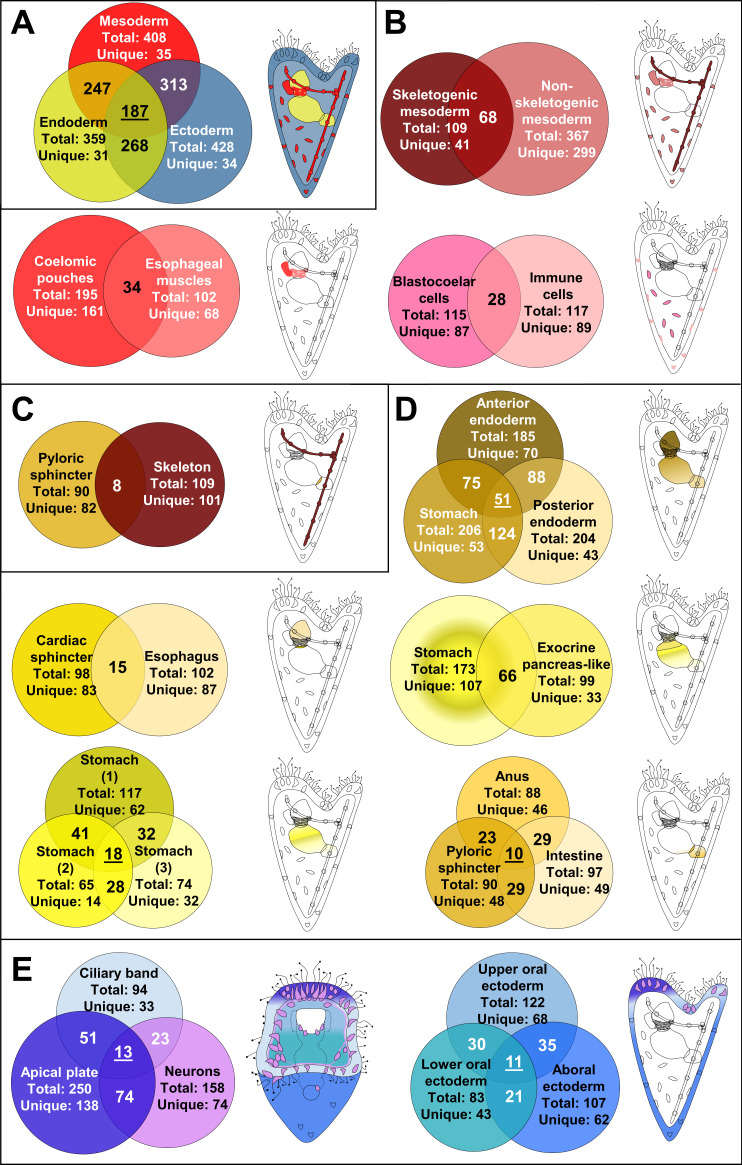
Figure 3. Regulatory states of the three dpf S. purpuratus larva.
(A) Comparison of the transcription factor content per germ layer. Venn diagram showing the shared and unique transcription factors per germ layer. Ectodermally derived cell type families are shown in blue, mesodermally derived in red, and endodermally derived in yellow. (B) Comparison of the transcription factor content across mesodermal lineages and cell type families. Venn diagram showing the shared and unique transcription factors per comparison. (C) Transcription factor content comparison of pyloric sphincter (endodermally derived) and skeletal cells (mesodermally derived), used as a negative control of our comparison. (D) Comparison of the transcription factor content per endodermal lineage and endodermally derived cell type families. Venn diagram showing the shared and unique transcription factors per comparison. (E) TF signature comparison of ectodermally derived cell type families. Venn diagram showing the shared and unique transcription factors per comparison. Cartoons indicated the relative position of each cell type family/lineage. Mesodermal cell type families/lineages are shown in shades of red, endodermal ones in shades of yellow and endodermal ones in shades of blue.


