. 2021 Nov 25;10:e70416. doi: 10.7554/eLife.70416

Figure 4. Localization of major transcription factor family members.

Dotplot showing the average scaled expression of members of the Homeobox, Forkhead and Ets transcription factor families. The developmental origins of each cell type family are shown in blue for ectodermally derived, red for mesodermally derived and yellow for endodermally derived ones.

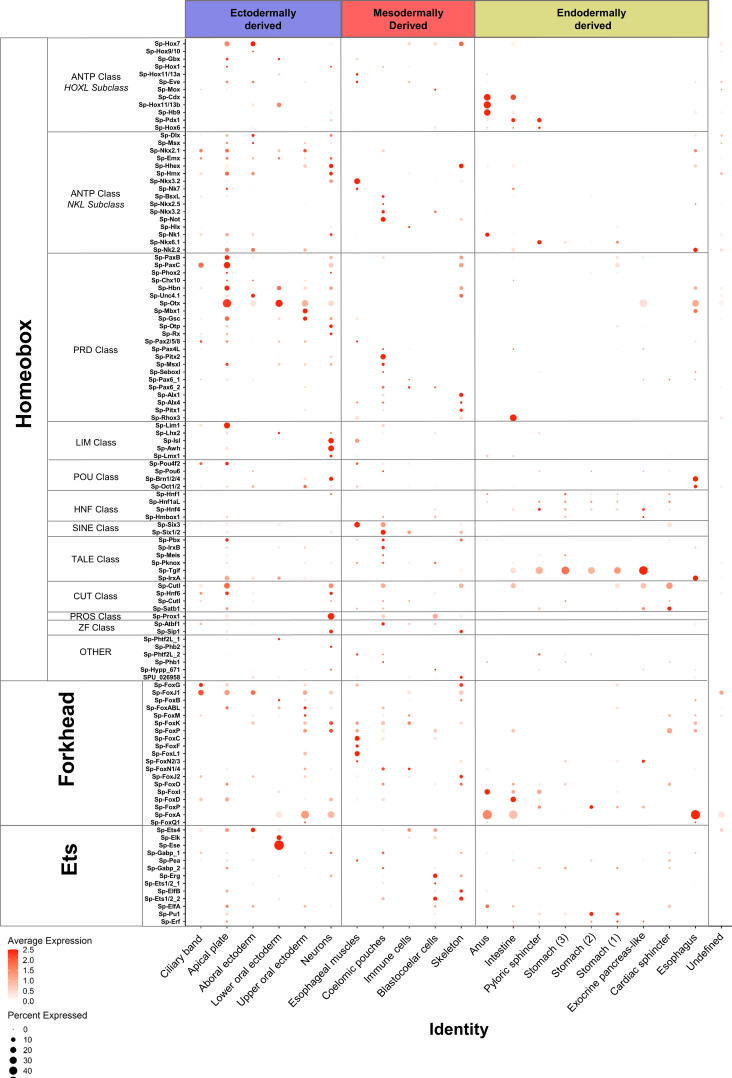
Figure 4.

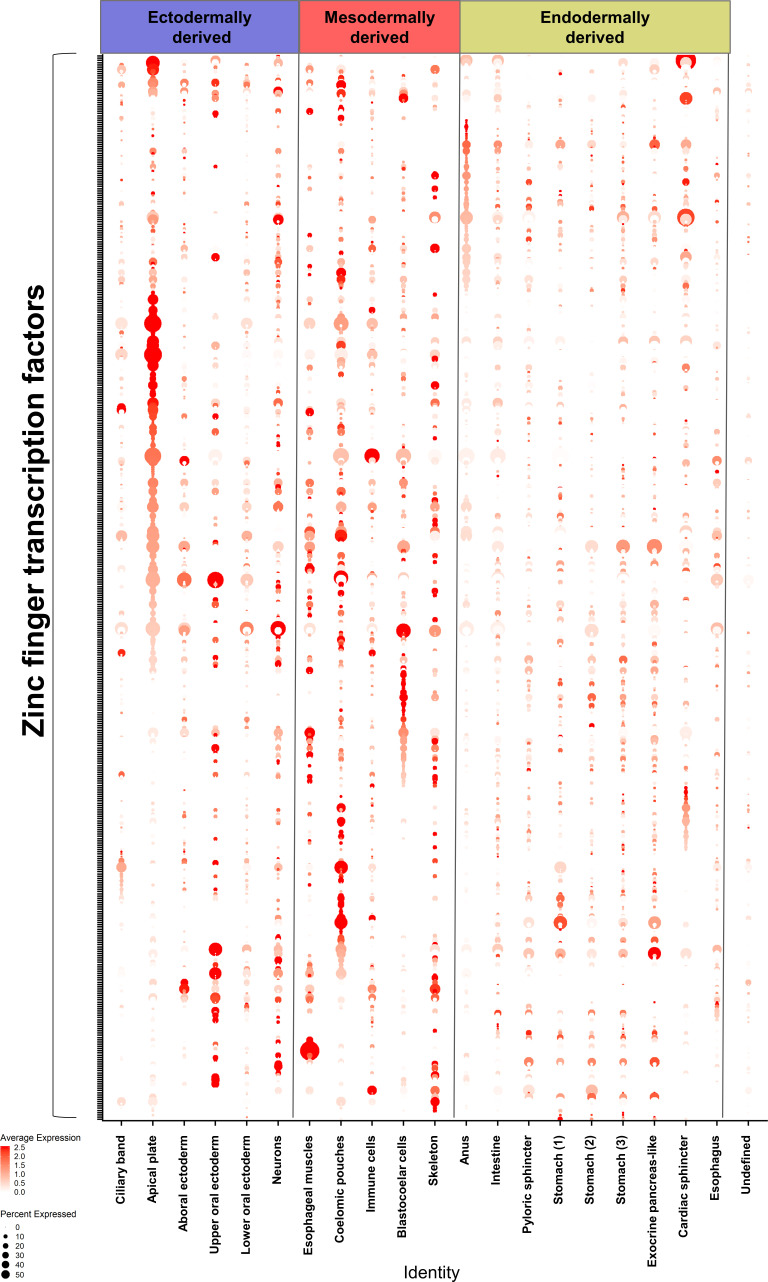
Figure 4—figure supplement 1. Distribution of the Zinc finger TF family members across the cell type families.

Figure 4—figure supplement 1.

Dotplot showing the mRNA average expression of the zinc finger transcription family members. The cell type families are grouped based on their developmental origins: ectodermally derived, in blue, mesodermally derived, in red and endodermally derived, in yellow.
Figure 4—figure supplement 2. Differentially expressed TFs across cell type families.

Figure 4—figure supplement 2.

Dotplot showing the average scaled expression of differentially expressed TFs with p-value less than 0.5 among the 21 clusters. The cluster order is according to the transcription factor-based tree as depicted in Figure 3—figure supplement 1B.