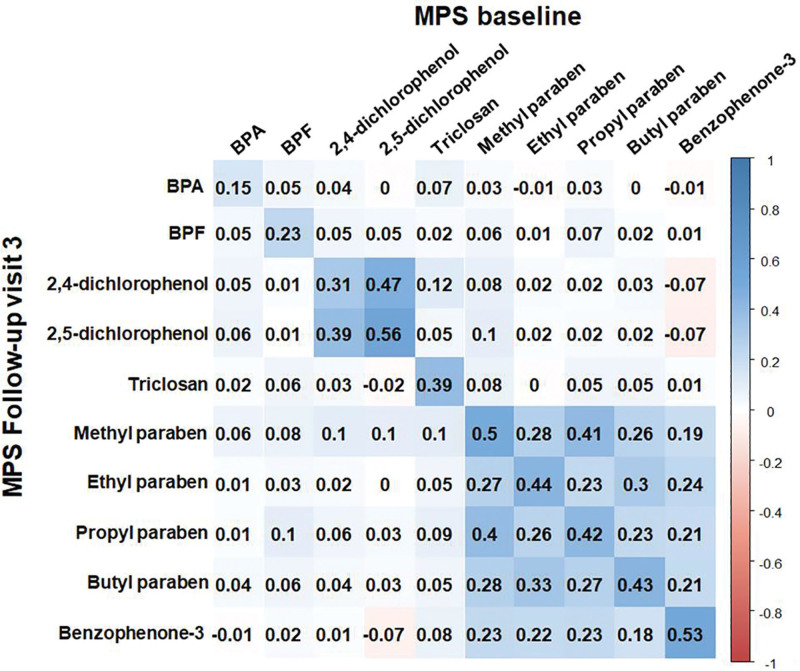
Figure 1.
Correlation coefficients matrix between log-transformed creatinine-adjusted urinary phenol and paraben concentrations at MPS baseline (1999–2000) and MPS follow-up visit 3 (2002–2003). The color intensity of boxes indicates the magnitude of correlation. Blue and red colors represent positive and negative correlations, respectively. BPA, bisphenol A; BPF, bisphenol F; MPS, multipollutant study.

