Figure 10.

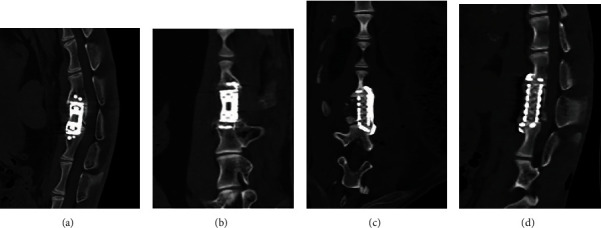
Sagittal (a.) and coronal (b.) CT images of the goat lumbar spine after the operation in the nonfusion group. Sagittal (c.) and coronal (d.) CT images of the goat lumbar spine at 6 months after the operation in the fusion group.

Sagittal (a.) and coronal (b.) CT images of the goat lumbar spine after the operation in the nonfusion group. Sagittal (c.) and coronal (d.) CT images of the goat lumbar spine at 6 months after the operation in the fusion group.