
Figure 13.
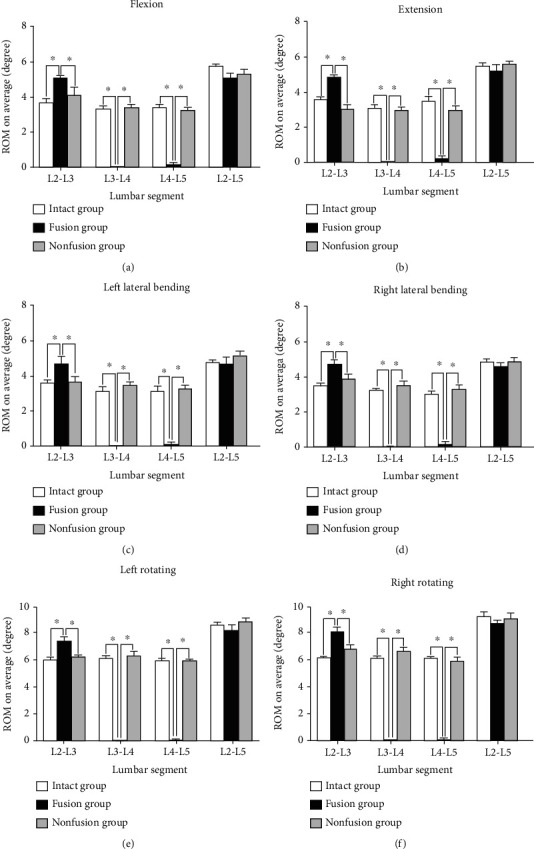
Statistical graph of the lumbar spine ROM of three groups. (a) ROM of flexion. (b) ROM of extension. (c) ROM of left lateral bending. (d) ROM of right lateral bending. (e) ROM of left rotating. (f) ROM of right rotating. ∗P < 0.05.
Official websites use .gov
A
.gov website belongs to an official
government organization in the United States.
Secure .gov websites use HTTPS
A lock (
) or https:// means you've safely
connected to the .gov website. Share sensitive
information only on official, secure websites.
Statistical graph of the lumbar spine ROM of three groups. (a) ROM of flexion. (b) ROM of extension. (c) ROM of left lateral bending. (d) ROM of right lateral bending. (e) ROM of left rotating. (f) ROM of right rotating. ∗P < 0.05.