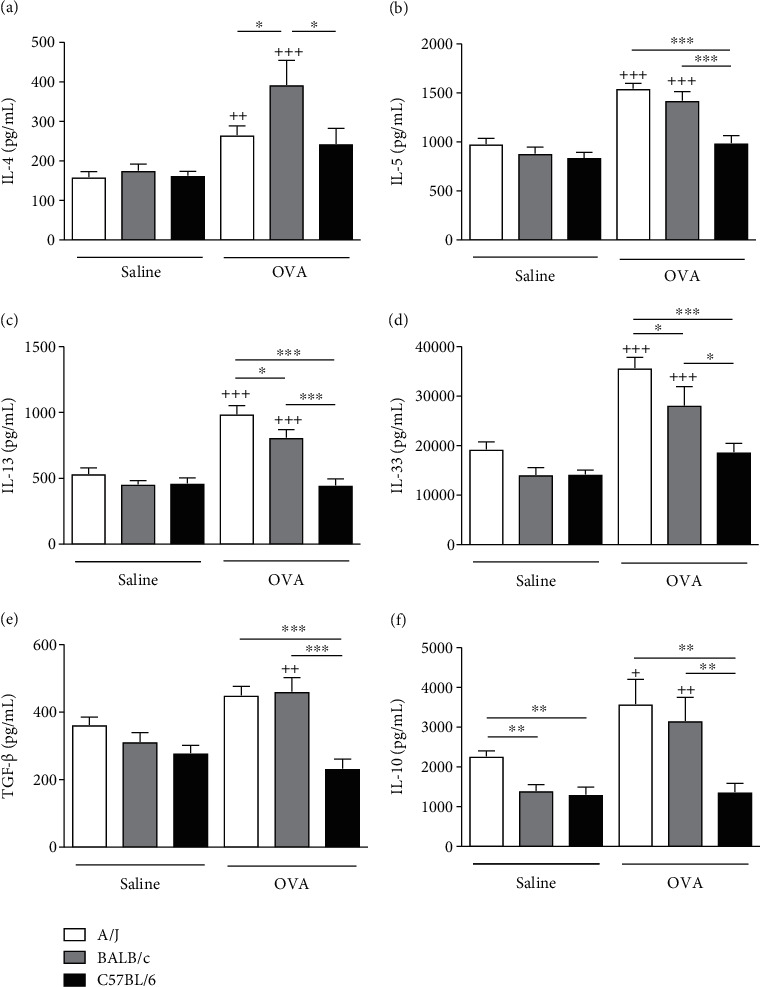
Figure 3.

Production of Th2 and anti-inflammatory cytokines in the lung tissue of A/J, BALB/c, and C57BL/6 mice challenged with either OVA or saline. Detection of cytokines IL-4 (a), IL-5 (b), IL-13 (c), IL-33 (d), TGF-β(e), and IL-10 (f) in the lung homogenate by ELISA. Values represent mean ± SEM of 5-6 animals per group. +P < 0.05 as compared to saline-challenged group. ++P < 0.01 and +++P < 0.001 as compared to saline-challenged group. ∗P < 0.05, ∗∗P < 0.01, and ∗∗∗P < 0.001 are comparisons of different OVA-challenged mouse strains.
