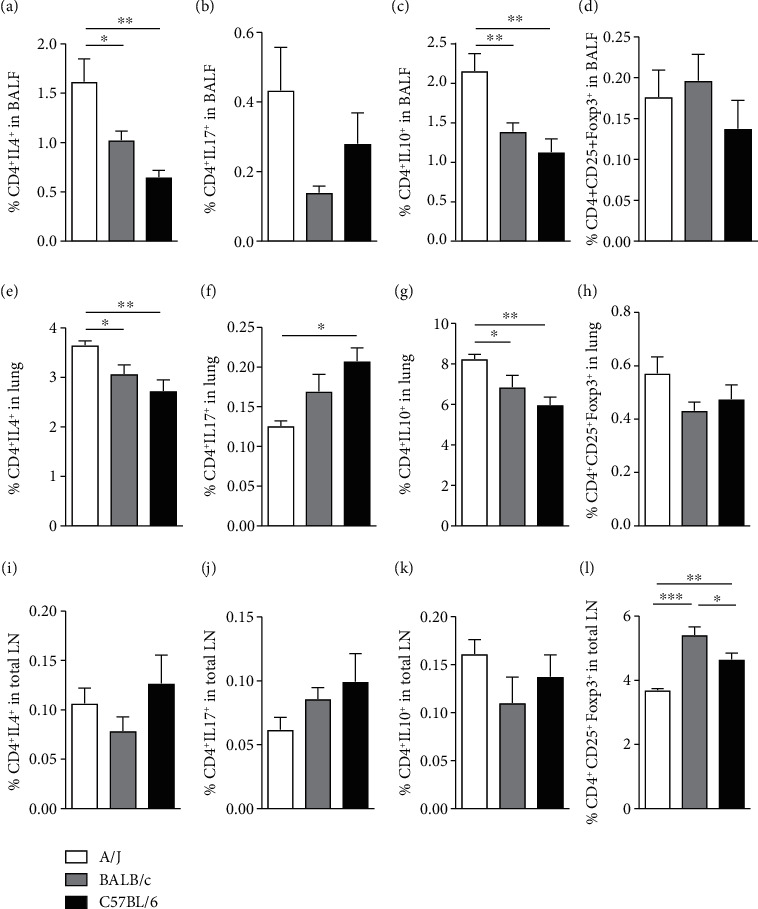
Figure 4.

Frequency of Th2, Th17, and regulatory T cells in the airways, lung parenchyma, and lymph nodes of A/J, BALB/c, and C57BL/6 naïve animals. Flow cytometric analysis of CD4+ cells producing IL-4, IL-17, and IL-10, and CD4+CD25+Foxp3+ Tregs, respectively, in the BALF (a–d), lung tissue (e–h), and in total lymph nodes (i–l). Values represent mean ± SEM of 4-5 animals per group. ∗P < 0.05, ∗∗P < 0.01, ∗∗∗P < 0.001.
