Figure 6.

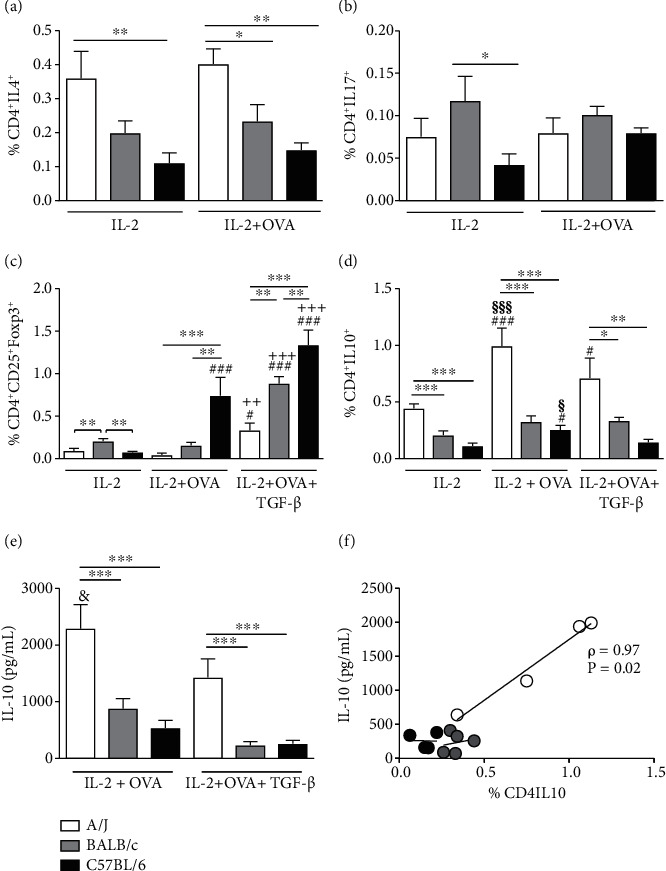
In vitro expansion of CD4+IL4+, CD4+IL17+, CD4+CD25+Foxp3+, and CD4+IL10+ cell populations from lymph nodes of A/J, BALB/c, or C57BL/6 OVA-challenged mice. Cells from mediastinal lymph nodes were cultured for 72 h in the presence IL-2, IL-2 + OVA, or IL-2 + OVA + TGF-β, and subpopulations of CD4+IL4+ (a) and CD4+IL17+ (b) CD4+CD25+Foxp3+ (c) or CD4+IL10+ (d) were analyzed by flow cytometry. IL-10 production in the supernatant of cultured cells was detected by ELISA (e). Values represent mean ± SEM of 4-5 animals per group. #P < 0.05 and ###P < 0.001 as compared to the same mouse strain group that received only IL-2. ++P < 0.01 and +++P < 0.001 as compared to the same mouse strain group that received IL-2 + OVA. §P < 0.05 and §§§P < 0.001 as compared to the same mouse strain group that received IL-2 + OVA + TGF-β. &P < 0.05 as compared to the same strain between different stimulus. ∗P < 0.05, ∗∗P < 0.01, ∗∗∗P < 0.001. Correlation between frequency of CD4+IL10+ cells and IL-10 production in cultures stimulated with OVA and TGF-β (f). Pseudo-r = 0.97, P = 0.02 by univariate analysis.
