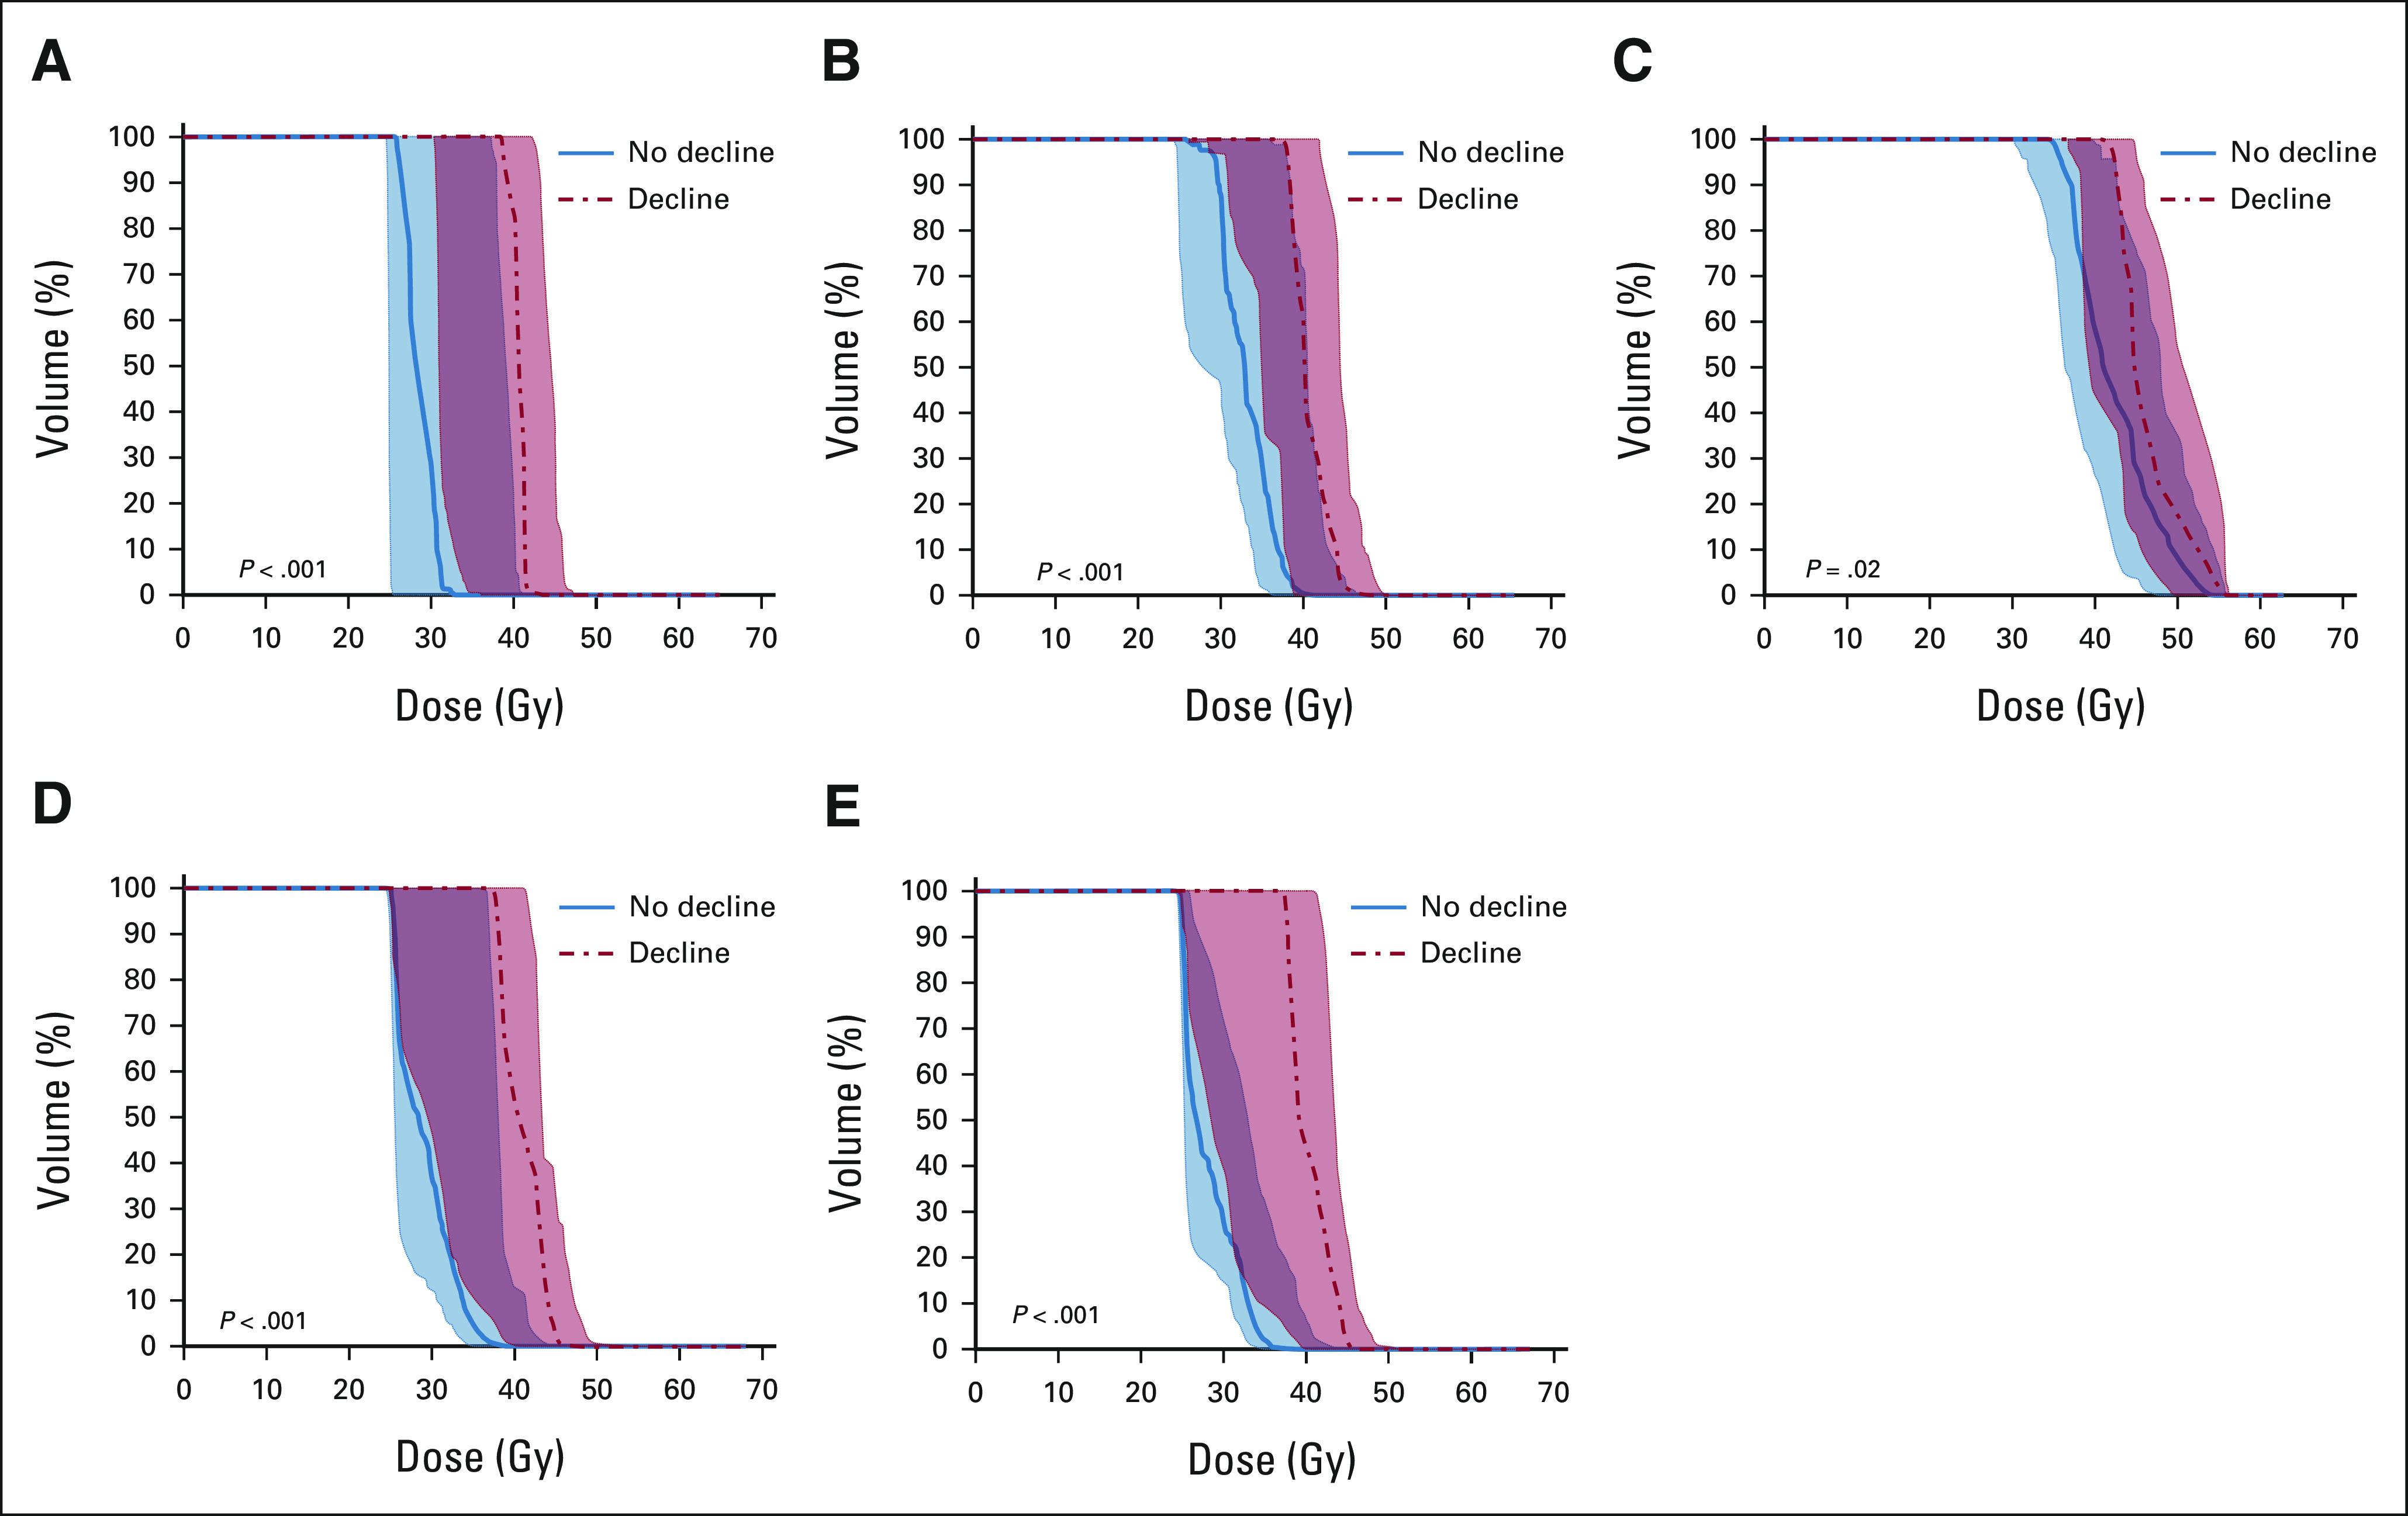
FIG A3.

Median population DVHs for patients exhibiting no decline (solid line, blue) compared with patients exhibiting decline (dotted line, red) in perceptual speed for the following brain substructures: (A) the CC genu, (B) the CC body, (C) the CC splenium, (D) the left frontal WM, and (E) the right frontal WM. The shaded region represents the 25th-75th percentile. CC, corpus callosum; DVH, dose–volume histogram; WM, white matter.
