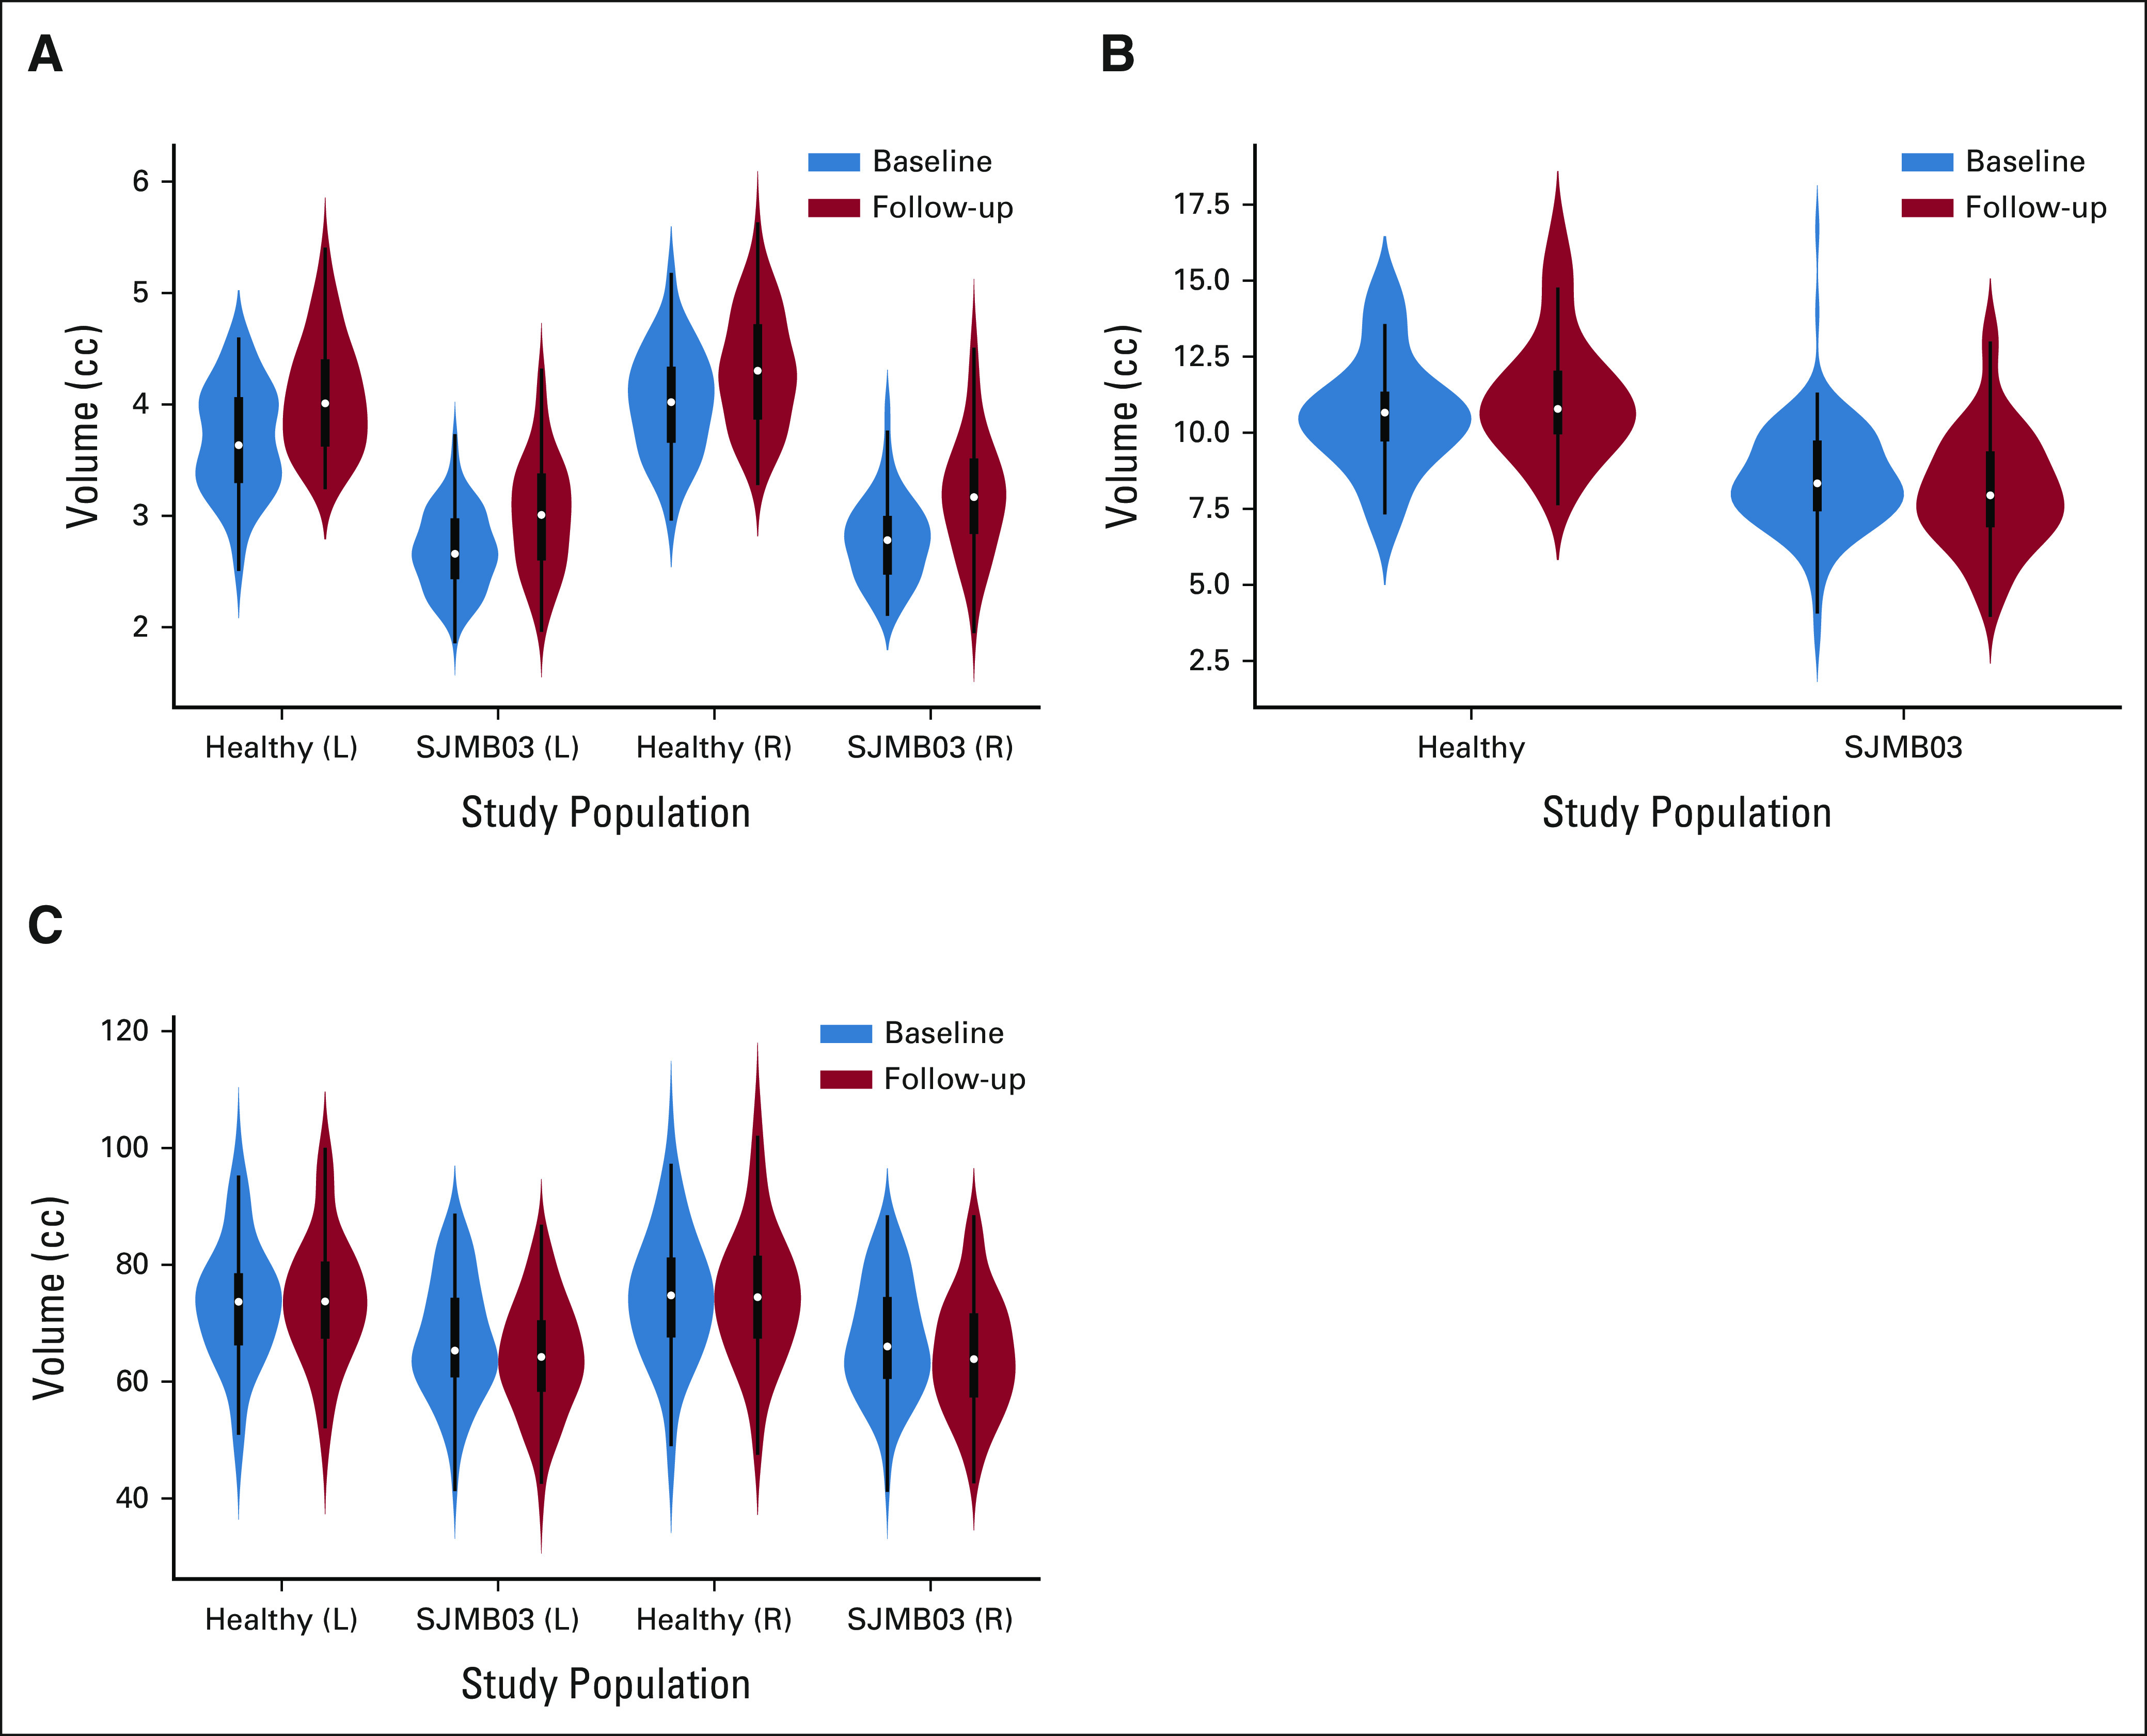
FIG A4.

Violin plots comparing patient (SJMB03) and healthy participant (healthy) substructure volumes for (A) the hippocampus, (B) the CC, and (C) the frontal WM. The follow-up time was 1-2 years after the baseline time point. CC, corpus callosum; L, left; R, right; WM, white matter.
