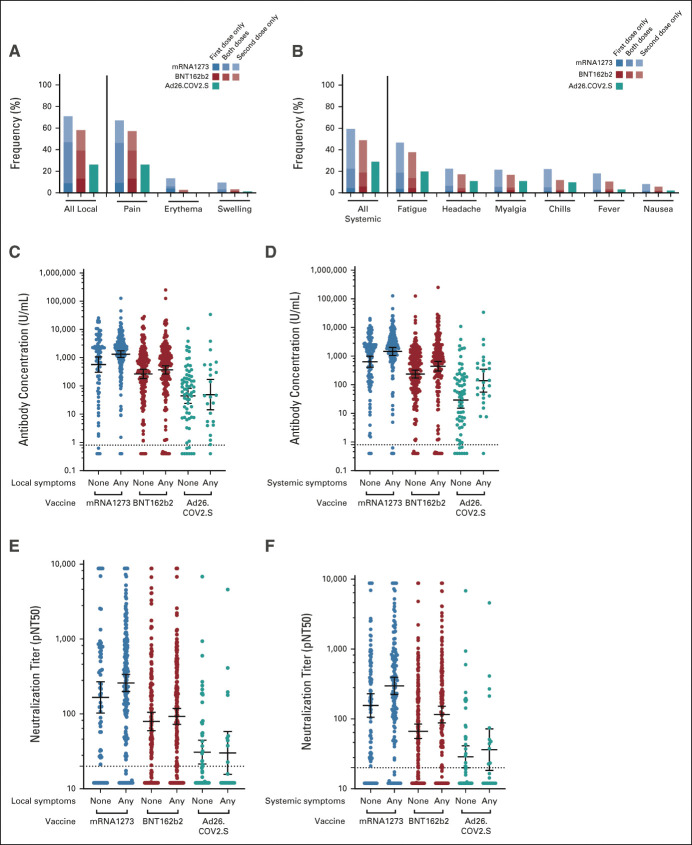
FIG 3.
Local (left column) and systemic (right column) reactogenicity of SARS-CoV-2 vaccines and their association with antispike immunoglobulin A/G/M antibody concentrations (middle row) or neutralization titer (bottom row). (A and B) Bars are colored according to vaccine (blue mRNA-1273, red BNT162b2, and teal Ad26.COV2.S) and timing of symptoms: lower solidly shaded box indicates after first dose only, middle moderately shaded box indicates after both doses, and upper lightly shaded box indicates after second dose only. (C-F) Horizontal line denotes the geometric mean concentration or titer and whiskers denote the 95% CI. pNT50, pseudovirus neutralization titer 50.

