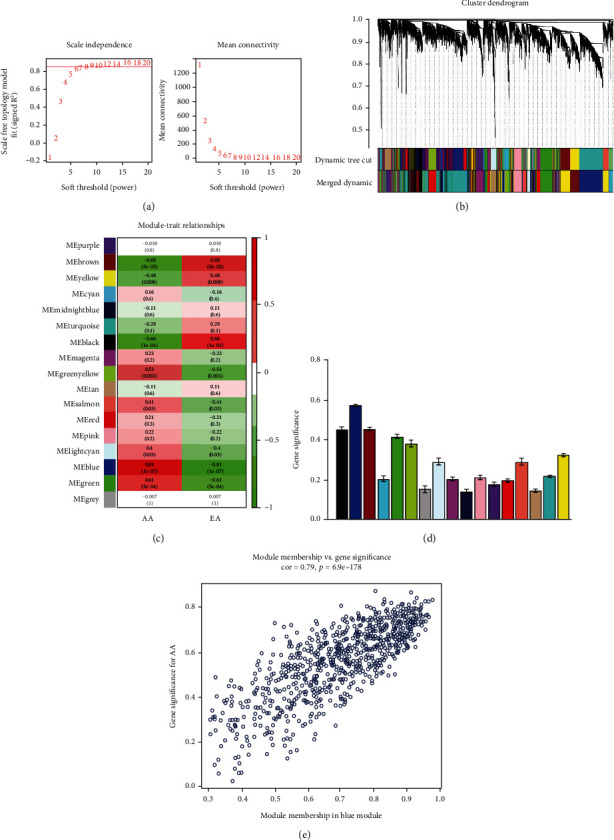
Figure 3.

Gene coexpression networks in samples of GSE28829 and module trait correlation analysis of key coexpression network. (a) Analysis of the scale-free index for soft-thresholding powers and 0.85 were used as the correlation coefficient threshold, and the best soft-thresholding power was 7. (b) Gene dendrogram and modules colors of 29 samples in GSE28829. (c) Heatmap of the correlation between modules and AA and EA. (d) Module significance values of all the 17 coexpression modules associated with AA. (e) The gene significance for AA in the blue module.
