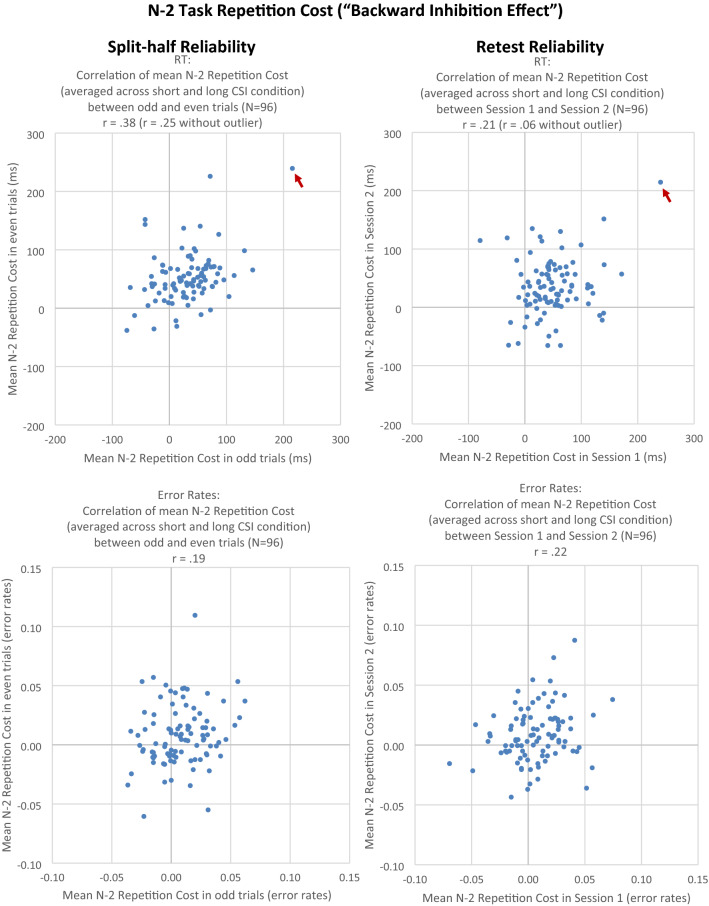
Fig. 2.
Experiment 1. Left column: correlation of N − 2 repetition cost between odd and even trials (split-half reliability). Right column: correlation of N − 2 repetition cost between Session 1 and Session 2 (retest reliability). Upper row: RT (in ms). Lower row: error rate. One dot represents one individual subject. Data points indicated by a red arrow were treated as outliers. The RT outliers in the plots for split-half and retest reliability stem from the same participant

