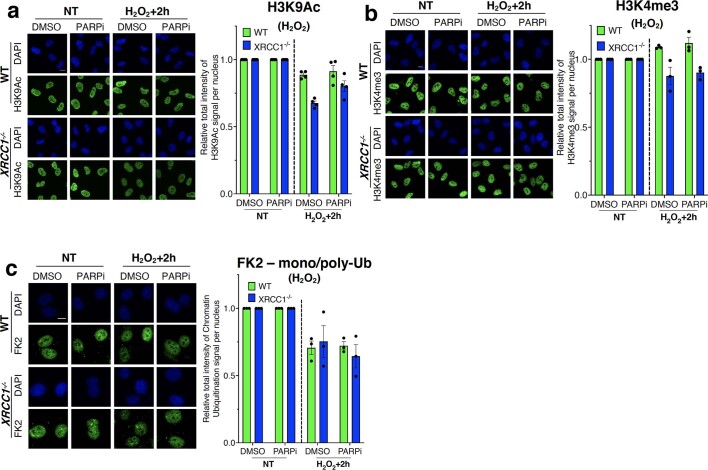
Extended Data Fig. 8. Levels of histone acetylation, methylation, protein ubiquitylation in XRCC1−/− RPE-1 cells.
a, Levels of H3K9Ac in RPE-1 cells, following treatment with 250 μM H2O2 for 5 min. Cells were incubated with 10 μM PARP inhibitor (PARPi) for 1 h prior to, during, and following H2O2 treatment. Quantification of H3K9Ac immunofluorescence shown on the right. Data are means (±s.e.m.) of four independent experiments. Scale bars, 10 μm. b, Levels of H3K4me3 in RPE-1 cells, following treatment with 250 μM H2O2 for 5 min. Cells were incubated with 10 μM PARP inhibitor (PARPi) for 1 h prior to, during, and following H2O2 treatment. Quantification of H3K4me3 immunofluorescence shown on the right. Data are means (±s.e.m.) of three independent experiments. Scale bars, 10 μm. c, Levels of chromatin mono/poly-ubiquitination (FK2) in RPE-1 cells, following treatment with 250 μM H2O2 for 5 min. Cells were incubated with 10 μM PARP inhibitor (PARPi) for 1 h prior to, during, and following H2O2 treatment. Quantification of chromatin mono/poly-ubiquitination immunofluorescence shown on the right. Data are means (±s.e.m.) of three independent experiments. Scale bars, 10 μm.

