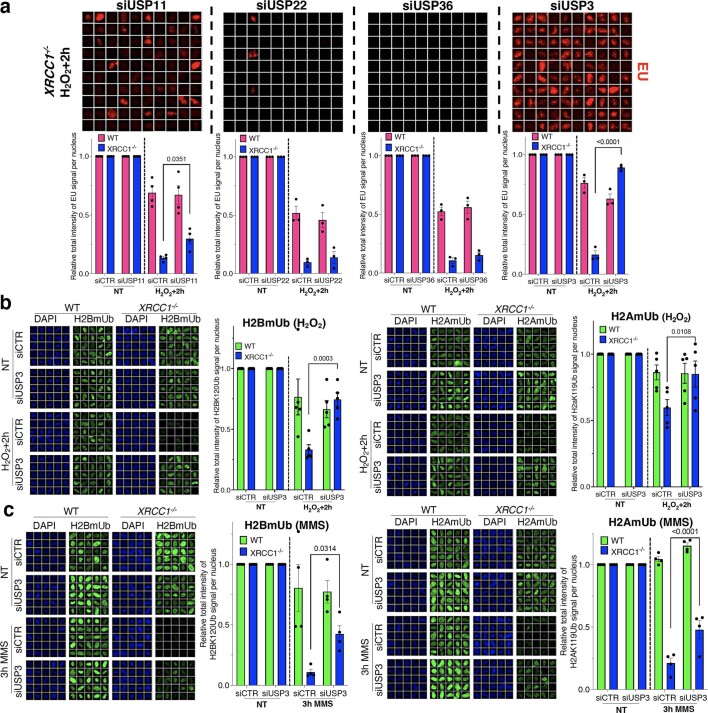
Extended Data Fig. 9. Activated PARP1 recruits USP3 to induce histone deubiquitination and transcription inhibition.
a, Global transcription (EU Immunofluorescence) in RPE-1 cells, following treatment with 250 μM H2O2 for 5 min. Representative images of cells 2 h after H2O2 are shown. Cells were pre-treated for 72 h with control or siRNA targeting USP11, USP22, USP36 and USP3. Quantifications are shown below images. Data are means (±SEM) of three or four independent experiments with statistical significance determined by Two-way ANOVA, Sidak’s multiple comparisons test (p values are indicated). b, Levels of H2BK120mUb (H2BmUb; left) and H2AK119mUb (H2AmUb; right) in RPE-1 cells, following treatment with 250 μM H2O2 for 5 min. Cells were pre-treated for 72 h with control or siRNA targeting USP3. Data are means (±SEM) of five independent experiments with statistical significance determined by two-way ANOVA with Sidak’s multiple comparisons test (p values are indicated). c, Levels of H2BmUb (left) and H2AmUb (right) in RPE-1 cells, following treatment with 0.1 mg/ml MMS for 3 h. Cells were pre-treated for 72 h with control or siRNA targeting USP3. Data are means (±SEM) of four independent experiments with statistical significance determined by two-way ANOVA with Sidak’s multiple comparisons test (p values are indicated).

