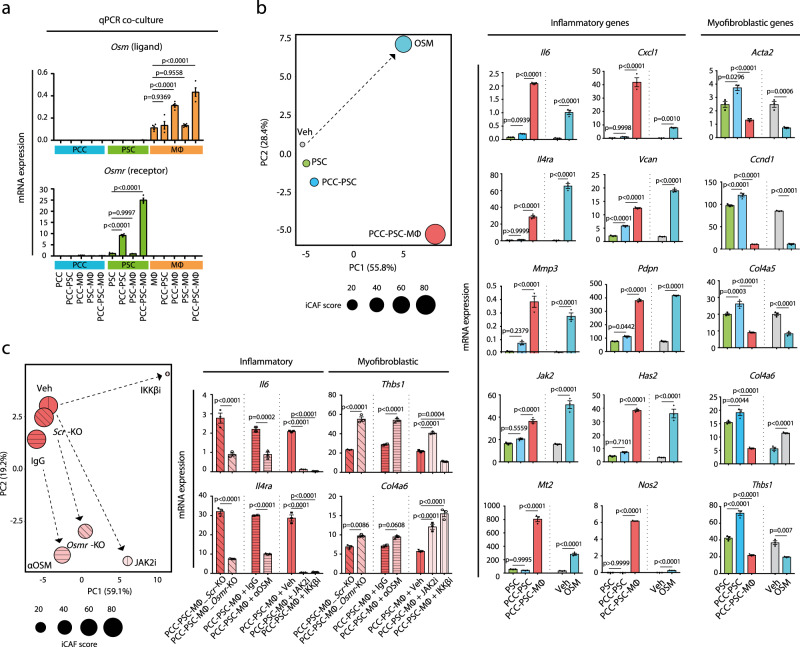
Fig. 3. Heterocellular OSM–OSMR signalling induces inflammatory fibroblasts.
a Cell-type-specific mRNA expression of Osm and Osmr across different culture conditions in vitro. Results displayed as mean ± SEM, n = 4, one-way ANOVA Tukey test. b RT-qPCR assay of myofibroblastic and inflammatory genes. PSCs were treated with recombinant OSM, conditioned medium or vehicle control, and gene expression analysis was performed. Left: Changes in expression state visualised by PCA. iCAF score is a sum of mean z-values of 15 selected inflammatory genes. Right: Representative mRNA expression of inflammatory and myofibroblastic genes of PSCs treated as indicated. Results displayed as mean ± SEM, n = 3, one-way ANOVA Tukey test. c RT-qPCR analysis of myofibroblastic and inflammatory genes in PSCs following pharmacological inhibitors and CRISPR–Cas9-medidated Osmr knockout (Osmr-KO) in PSCs. For inhibitor perturbation, PSCs were stimulated with conditioned medium supplemented with vehicle control, IKKβ inhibitor (TPCA-1, 1 µM), JAK2 inhibitor (AZD1480, 2.5 µM), control IgG antibody (2.5 ng/mL) or neutralising OSM antibody (αOSM, 2.5 ng/mL). For Osmr knockout, scrambled (Scr) control and Osmr-KO fibroblasts were stimulated with PCC–PSC–MØ conditioned medium and gene expression was analysed by RT-qPCR. Left: Changes in expression state visualised by a PCA plot. iCAF score is a sum of mean z-values of 15 selected inflammatory genes. Right: Representative mRNA expression of inflammatory (Il6 and Il4ra) and myofibroblastic (Thbs1 and Col4a6) genes of PSCs treated as indicated. Results displayed as mean ± SEM, n = 3, one-way ANOVA Tukey test. Also see Supplementary Fig. 3. Source data are provided as a Source Data file.

