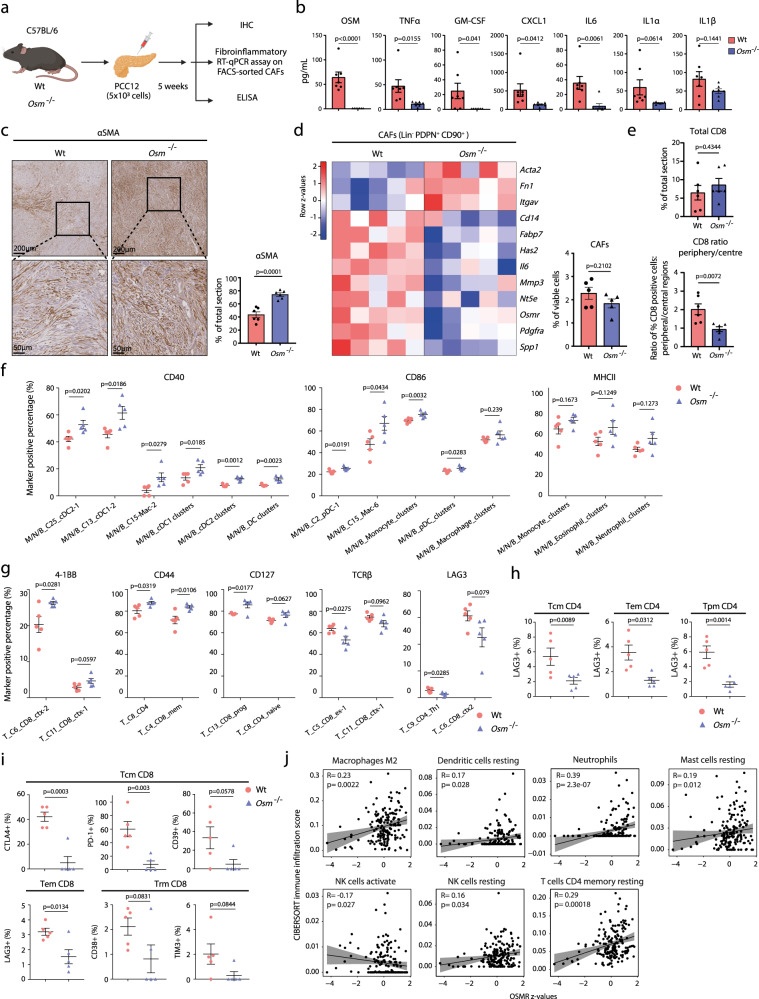
Fig. 5. OSM supports the formation of an immunosuppressive microenvironment.
a Experimental workflow of in vivo experiments. b Protein levels of indicated soluble signals in wildtype (n = 7) and Osm−/− (n = 7) tumours, measured by ELISA. Results displayed as mean ± SEM, two-tailed student t test. c Immunohistochemical analysis of αSMA in wildtype and Osm−/− tumour sections. Left: Representative αSMA staining. Right: Quantification of αSMApos staining of tumour sections of wildtype (n = 6) and Osm−/− (n = 6) animals. Results displayed as mean ± SEM, two-tailed student t test. d RT-qPCR gene expression analysis of FACS-isolated CAFs from wildtype (n = 5) and Osm−/− (n = 5) tumours displayed as a heatmap (left). Number of isolated CAFs shown as bar plot (right). Results displayed as mean ± SEM, two-tailed student t test. e Immunohistochemical analysis of CD8 in wildtype (n = 6) and Osm−/− (n = 6) animals. Upper: Total CD8pos staining. Lower: Ratio of peripheral/central CD8pos staining using the mean CD8pos stain from four representative peripheral regions and four representative central regions per tumour. Results displayed as mean ± SEM, two-tailed student t test. f Mass cytometry analysis quantifying abundance of antigen presenting cells (APCs) expressing co-stimulatory markers in wildtype (n = 5) and Osm−/− (n = 5) tumours. Results displayed as mean ± SEM. Unpaired two-tail student t test. g Mass cytometry analysis of CD45+/CD3+ T cells expressing indicated markers in wildtype (n = 5) and Osm−/− (n = 5) tumours. Results displayed as mean ± SEM, two-tailed student t test. h, i Mass cytometry analysis of memory T cells expressing indicated exhaustion/dysfunction markers in wildtype (n = 5) and Osm−/− (n = 5) tumours. Results displayed as mean ± SEM, two-tailed student t test. Tcm central memory, Tem effector memory, Trm resident memory. j Spearman correlation analysis between infiltration of indicated immune cells (determined by CIBERSORT) and OSMR expression levels in PDA patients from TCGA PanCancer PAAD dataset (n = 179). 95% confidence interval as shaded area. Also see Supplementary Figs. S5 and S6. Source data are provided as a Source Data file.

