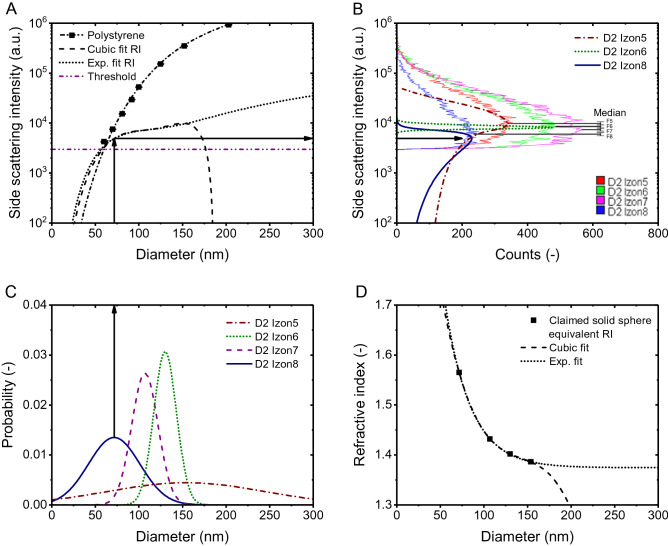
Figure 2.
(A) Side scattering intensity measured (symbols) by a CytoFLEX1 and calculated (lines) by Mie theory10 versus diameter for polystyrene beads (squares). The assumed refractive index (RI) is 1.627 for polystyrene beads. EVs were modelled as particles with the diameter dependent solid particle equivalent RIs shown in panel D. The horizontal line indicates the trigger threshold. (B) Side scattering intensity of CD61 + EVs from fractionated plasma versus counts measured (light lines) by the CytoFLEX1 and predicted (dark lines) based on the measured size distribution in (C) and the scatter to diameter relation in (A) (black arrows). Colors indicate size exclusion chromatography fractions 5 (red and dash-dotted brown), 6 (green and dotted dark green), 7 (purple) and 8 (blue and solid dark blue). Fraction 7 resulted in a similar side scattering distribution as fraction 6 and is left out for clarity. Predictions do not describe the data. (C) Size distribution of particles from the same fractionated plasma as in panel B measured by dynamic light scattering (DLS; µIzon5 = 153.82 nm, PDIIzon5 = 0.34, σIzon5 = 89.7 nm, µIzon6 = 130.17 nm, PDIIzon6 = 0.01, σIzon6 = 13.0 nm, µIzon7 = 106.99 nm, PDIIzon7 = 0.02, σIzon7 = 15.1 nm, µIzon8 = 71.66 nm, PDIIzon8 = 0.17, σIzon8 = 29.5 nm). (D) Refractive index versus solid particle equivalent diameter claimed by Brittain et al. (symbols) fitted with a cubic function (y0 = 2.51109, A1 = − 0.02223, A2 = 1.51337E-4, A3 = 4, A4 = − 3.53334E-7) and with an exponential function (y0 = 1.37456, A = 2.12974, t1 = 29.67714).

