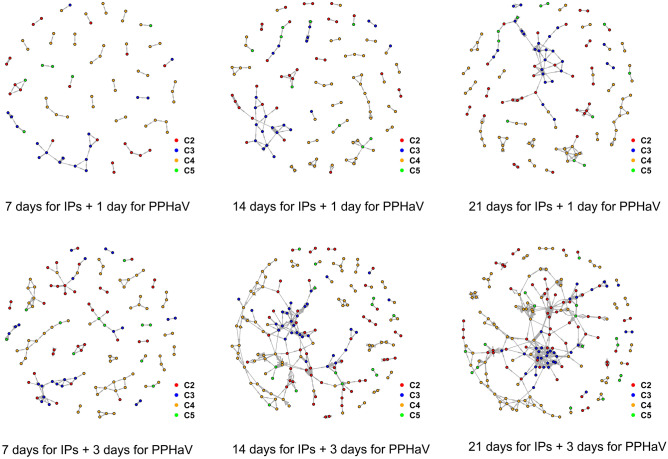
Figure 1.
Graphical representation of networks consisting of all infected premises (IPs), constructed by under different temporal assumption on infectious duration for IPs and poultry production and health associated vehicle (PPHaV) movements. Each of figures represent the contact network between IPs, under the different infectious duration for IPs and vehicle movement. The plots in the top row display one day infectious duration for vehicle movement with seven days infectious duration for IPs (top left), 14 days duration (top middle), and 21 days duration for IPs (top right). The plots in the bottom rows depict three days duration for vehicle movement with seven days infectious duration for IPs (bottom left), 14 days duration (bottom middle), and 21 days duration for IPs (bottom right). Colored dot denotes specific genotype IPs; red for C2, blue for C3, yellow for C4 and green for C5.

